Functions Used to Change the Display
Last updated on 2026-04-22
Overview
This article gives an overview of the functions that are available in Consolidation & Financial Planning to change the display of elements and to show additional information.
This article contains the following sections:
Showing and Hiding Areas
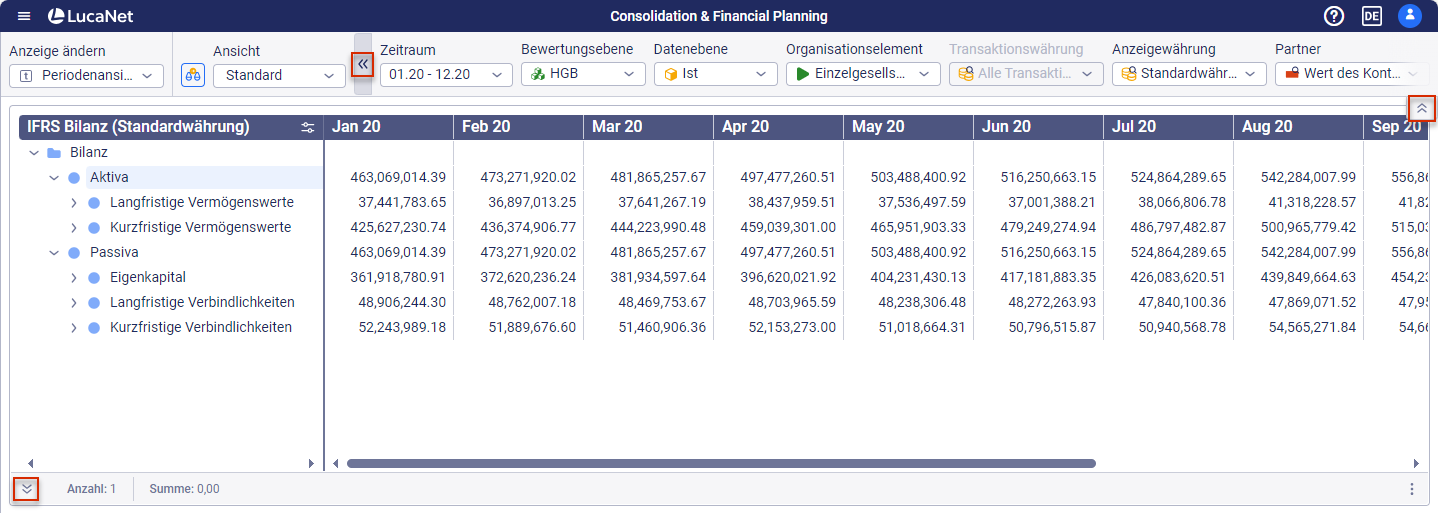
In the Consolidation & Financial Planning solution, you can show or hide certain areas using ![]() to make it easier to view elements or items and accounts, e.g. in the balance sheet. The areas you can show or hide include the Status bar, the Dimension bar, the treeview and the detail view.
to make it easier to view elements or items and accounts, e.g. in the balance sheet. The areas you can show or hide include the Status bar, the Dimension bar, the treeview and the detail view.
To change the order of views in the tree view, mark the desired view, hold the mouse button, and move the view to the desired position.
Expanding and Collapsing Elements
Subordinate levels of elements can be expanded in the tree view to show more details or collapsed to have a better overview. In the tree view, navigate to a folder and open the context menu.
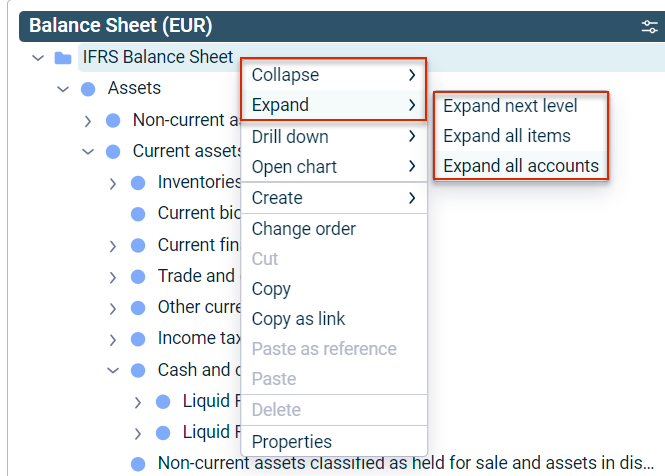
In the tree view of the Reporting and Analyzing functional area, you can also use the context menu for items and accounts to define whether you want to expand all levels, all items, or all accounts in each case.
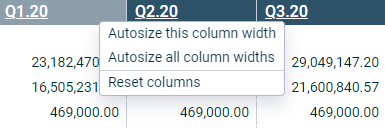
Changing Column Widths
For a better overview, certain or all column widths in tables can be automatically adjusted or the adjustment of the columns reset. To do this, navigate to the header of the desired column and open the context menu to adjust the desired setting.
Limiting the Number of Workspaces
The available workspaces can be limited or extended when selecting elements. To do so, click Select workspaces, for example, to create a KPI card in the Dashboard workspace:
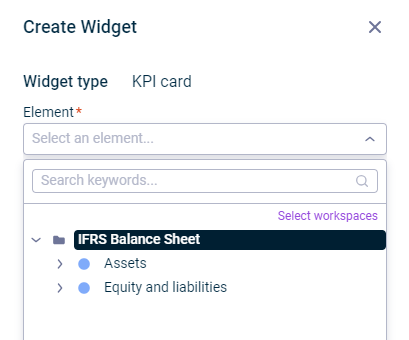
Choose additional workspaces by activating the check boxes or limiting the selection.
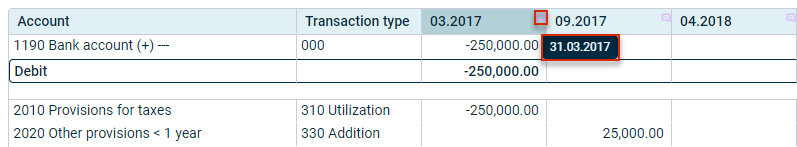
Displaying Additional Information
A comment icon indicates that additional information is stored in the software for a particular entry, e.g. the exact posting date for the display of values of a posting in the Journals workspace: