Knowledge Base Support Customer Portal About Lucanet SBOM
For more information, seeViewing Product Versions Accessing and Downloading SBOMs
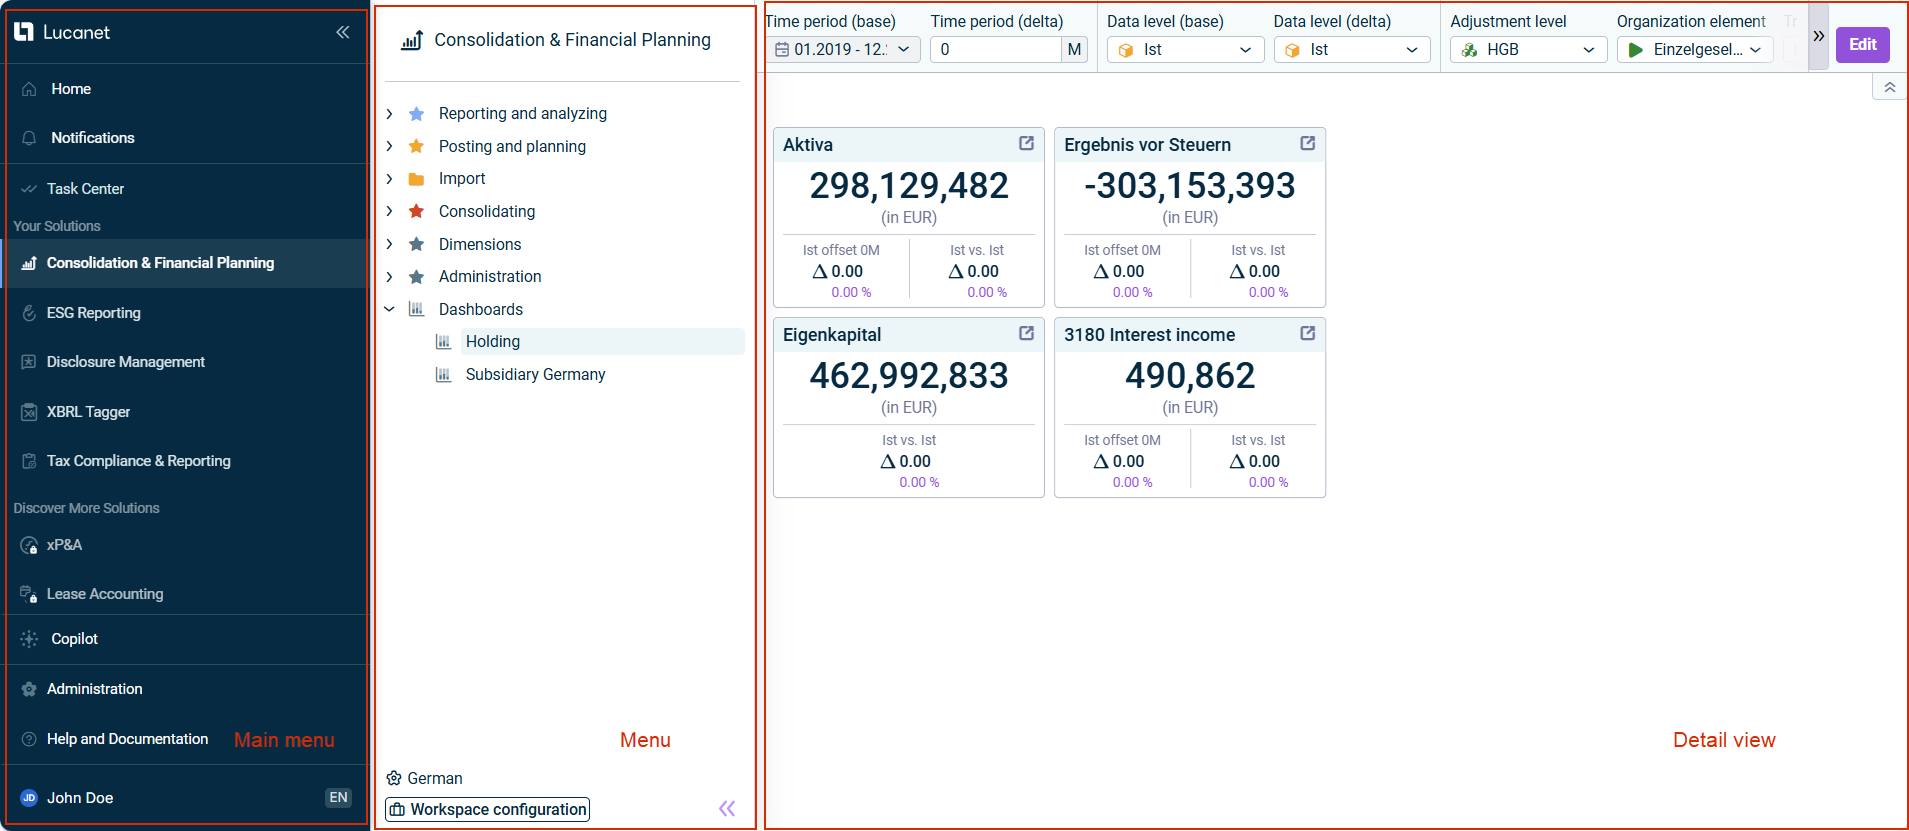
Licensed and unlicensed modules within the selected solution Functional areas and workspaces of the selected solution Other configuration options
Click the 

Drag and drop the dividing line between the main menu and the menu to hide or show the element names in the main menu.
Click the 

Drag and drop the dividing line between the menu and the detail view to resize the width of the menu.
Last updated on Aug 16, 2023