Comparing Versions or Scenarios in Charts and Tables
Last updated on 2025-05-06
Overview
You often might want to compare different versions and/or scenarios of your model, for example to:
- Learn how your actual performance compares to your budget or forecast (Budget vs. Actuals, Forecast vs. Actuals)
- See how different scenarios affect your numbers (Scenario A vs. Scenario B)
- Compare how a new scenario stacks up against your original forecast (Scenario A vs. Current Forecast)
In xP&A, you can easily compare versions or scenarios of your model on charts and tables.
Special Versions
xP&A auto-creates a few special versions of your model that you can refer to in tables and charts:
- Current takes the current values of your model, i.e. it takes data for the months for which historical data are available, and uses the formulas for forecast months. Whenever you create a chart or table, this is always the default.
- Actuals includes all current values in the model up to and including the Last Actual Date. If there is no Last Actual Date set, xP&A will return none.
- Rolling Forecast takes the most recent version of each timestep’s value, where that month was still a “forecast” and not an “actual”, according to the Last Actual Date when the version was saved.
- Data includes all current values that come from a data source.
This article contains the following sections:
Comparing Versions or Scenarios in Charts
To compare model versions or scenarios in a chart, you have the following options:
As a Dimension Breakdown
By default, a chart always shows the values of the variables of the currently active scenario and the base version as the current version.
To see or compare the values of other scenarios or versions, you can easily switch to other versions or add them for comparison:
- Click the edit icon
 in the top-right corner of a chart visual and go to the Setup tab.
 - Navigate to the Dimensions breakdown section.
By default, the Active scenario and the Current version are selected. - Choose between one of the following options:
- If you want to see the values of another scenario or version only, hover over the selected scenario, open the dropdown menu using the arrow, and choose the desired scenario or version:
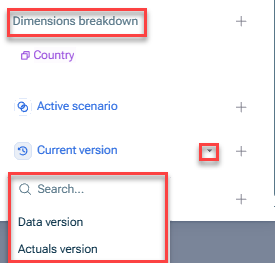
Changing a version - If you want to see the values of another scenario or version additionally to compare them, click the + icon and add the desired scenario or version:
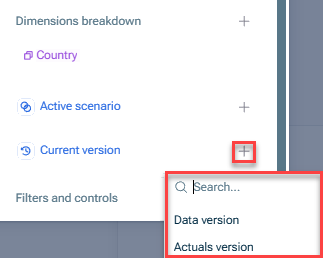
Adding a version
- If you want to see the values of another scenario or version only, hover over the selected scenario, open the dropdown menu using the arrow, and choose the desired scenario or version:
As a Filter
You can add the versions or scenarios as a filter to your chart to see one scenario or version at a time and view each as an own page:
- Click the edit icon in the top-right corner of a chart visual and go to the Setup tab.
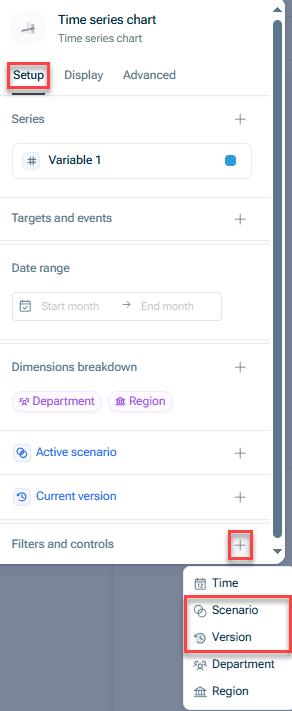
- Navigate to the Filters and controls section and click the + sign.
- Choose Scenarios and/or Versions, depending on what you want to set a filter for:
Adding versions or scenarios as a filter - The respective filter appears as a drop-down list on the top left of the chart visual:
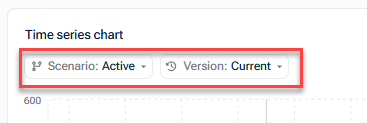
Filters added to a chart
Comparing Versions or Scenarios in Tables
To compare model versions or scenarios in a table, you have the following options:
As a Row or Column
You can add the versions or scenarios as a row or column to view them side-by-side:
- Click the edit icon in the top-right corner of a table visual and go to the Setup tab.
- Navigate to the Columns or Rows section and click the + sign.
- Choose Scenarios or Versions, depending on what you want to compare:
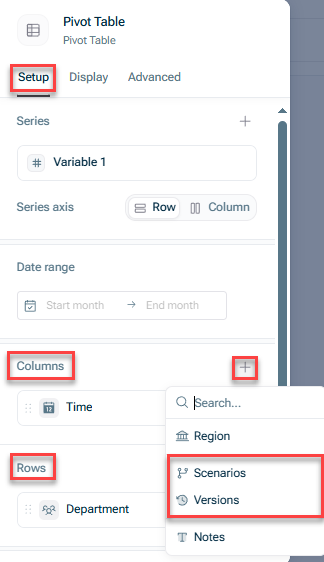
Adding versions or scenarios as a column - Click on the Scenarios or Versions item that you just added to the Columns or Rows section. In the menu that is displayed, add the additional scenario or additional version you want to compare:
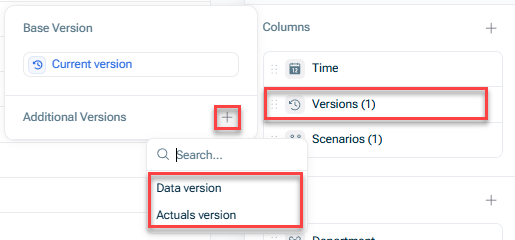
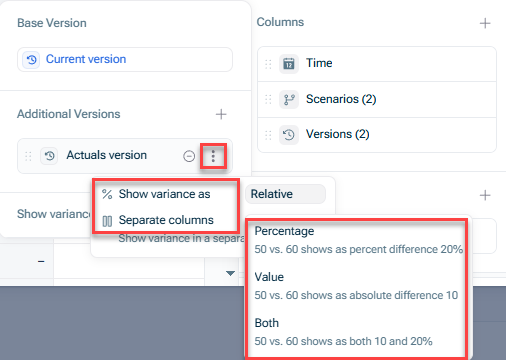
Adding the version to be compared - Choose if you want to show the variance between the compared base and the additional version(s) or scenario(s) in the table.
- If you show the variance between the compared versions or scenarios, you can additionaly decide how you want to show them using the three-dot menu of the additional version or scenario.
You have the following options:- Show variance as a percentage, value or both
- Show variance in a separate column
As a Filter
You can add the versions or scenarios as a filter to see one scenario or version at a time and view each as an own page:
- Click the edit icon in the top-right corner of a table visual and go to the Setup tab.
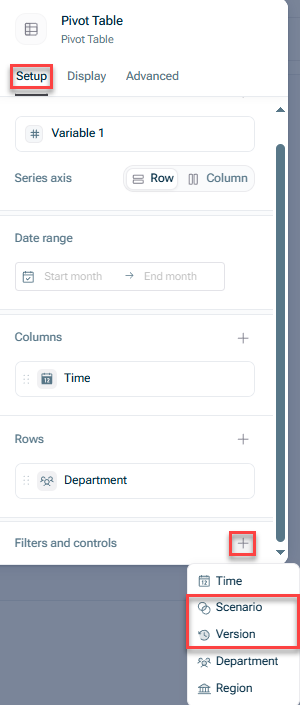
- Navigate to the Filters and controls section and click the + sign.
- Choose Scenarios and/or Versions, depending on what you want to set a filter for:
Adding versions or scenarios as a filter - The respective filter appears as a drop-down list on the top of the table visual:
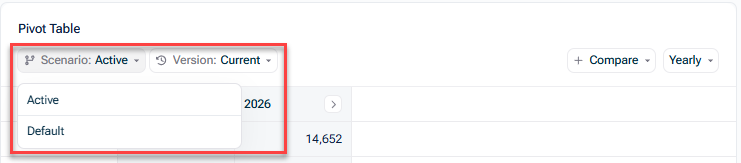
Filters added to a table