Groups are sets of variables within sections. You can also create nested groups simply by creating a group under an existing group.

Groups can be created as follows:

1

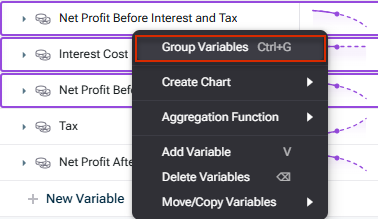
Hold down the CTRL key and select the elements to be included in the new group.

2

Press CTRL+G or choose Group Variables in the context menu.

Grouping variables
3

Enter a name for the new group.

Aside from visual organisation in the spreadsheet, groups can also be used for:

  • These totals will automatically stay up to date as new variables are added, or existing variables are removed, from the group/section.
  • In the spreadsheet: hit the sum icon at the top of the group/section row (see Using Sections).
  • On tables: add a group/section as a series to add its variables as well as a total row (see Using Sections).

Easily sum (or avg/min/max...) the variables within the group. Just type sum(Group Name) and xP&A will sum all the variables within that group. When variables are added to (or removed from) the group, the function (e.g. sum) will auto-update.

If you add a Group to a table (as opposed to the individual variables), then the table will automatically stay up to date as variables are added/removed from the group in the spreadsheet (see Using Sections).

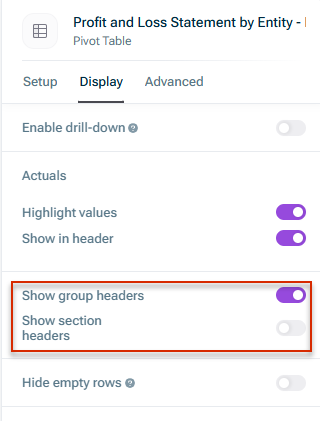
Organise variables under Group name headers on tables. You can toggle this setting off under Display | Show group headers.

Shows the 'Display' tab of the details of a table. Highlighted is the section with the options 'Show group headers' and 'Show section headers'
Display settings for table headers

This content was generated using AI and reviewed by Lucanet subject matter experts before publication.