Basic Concepts and Elements
Last updated on 2025-03-03
Overview
The following section describes the most important concepts and elements in Lucanet xP&A. Further details can be found under the links provided.
Concepts and elements
The following concepts and elements are used in Lucanet xP&A:
Option
Description
Model
In Lucanet xP&A, a model is a powerful tool for financial planning and analysis. Think of it like a structured spreadsheet where you can input data, build formulas, and run calculations.
You can organize models into folders, share them, clone them, and link them to other models — all within the xP&A interface for seamless navigation and management.
For more information on models, see Creating a Model and Working with Models.
Scenario
A scenario in Lucanet xP&A is a dynamic version of your model where specific variables or values change, but the overall structure — variables, groups, and sections — stays the same.
Scenarios let you test different assumptions, compare outcomes, and make data-driven decisions without altering your core model.
For more information on scenarios, see Scenarios.
Spreadsheet vs. Dashboard
The spreadsheet is where you enter and manage a model’s inputs and calculations. It is the core workspace for data entry, applying formulas, and structuring your financial model.
The dashboard is where your data comes to life. It is the visual layer that transforms your inputs into charts and insights, helping you analyze trends and make informed decisions.
Easily switch between the spreadsheet (data input and calculations) and the dashboard (visualization and analysis) using the toolbar.
Variable
Variables are the building blocks of your models. You can define a variable using a formula.
Variables can be one single row, or they can consist of one top row and constituent rows (if the variable is broken down into dimension items).
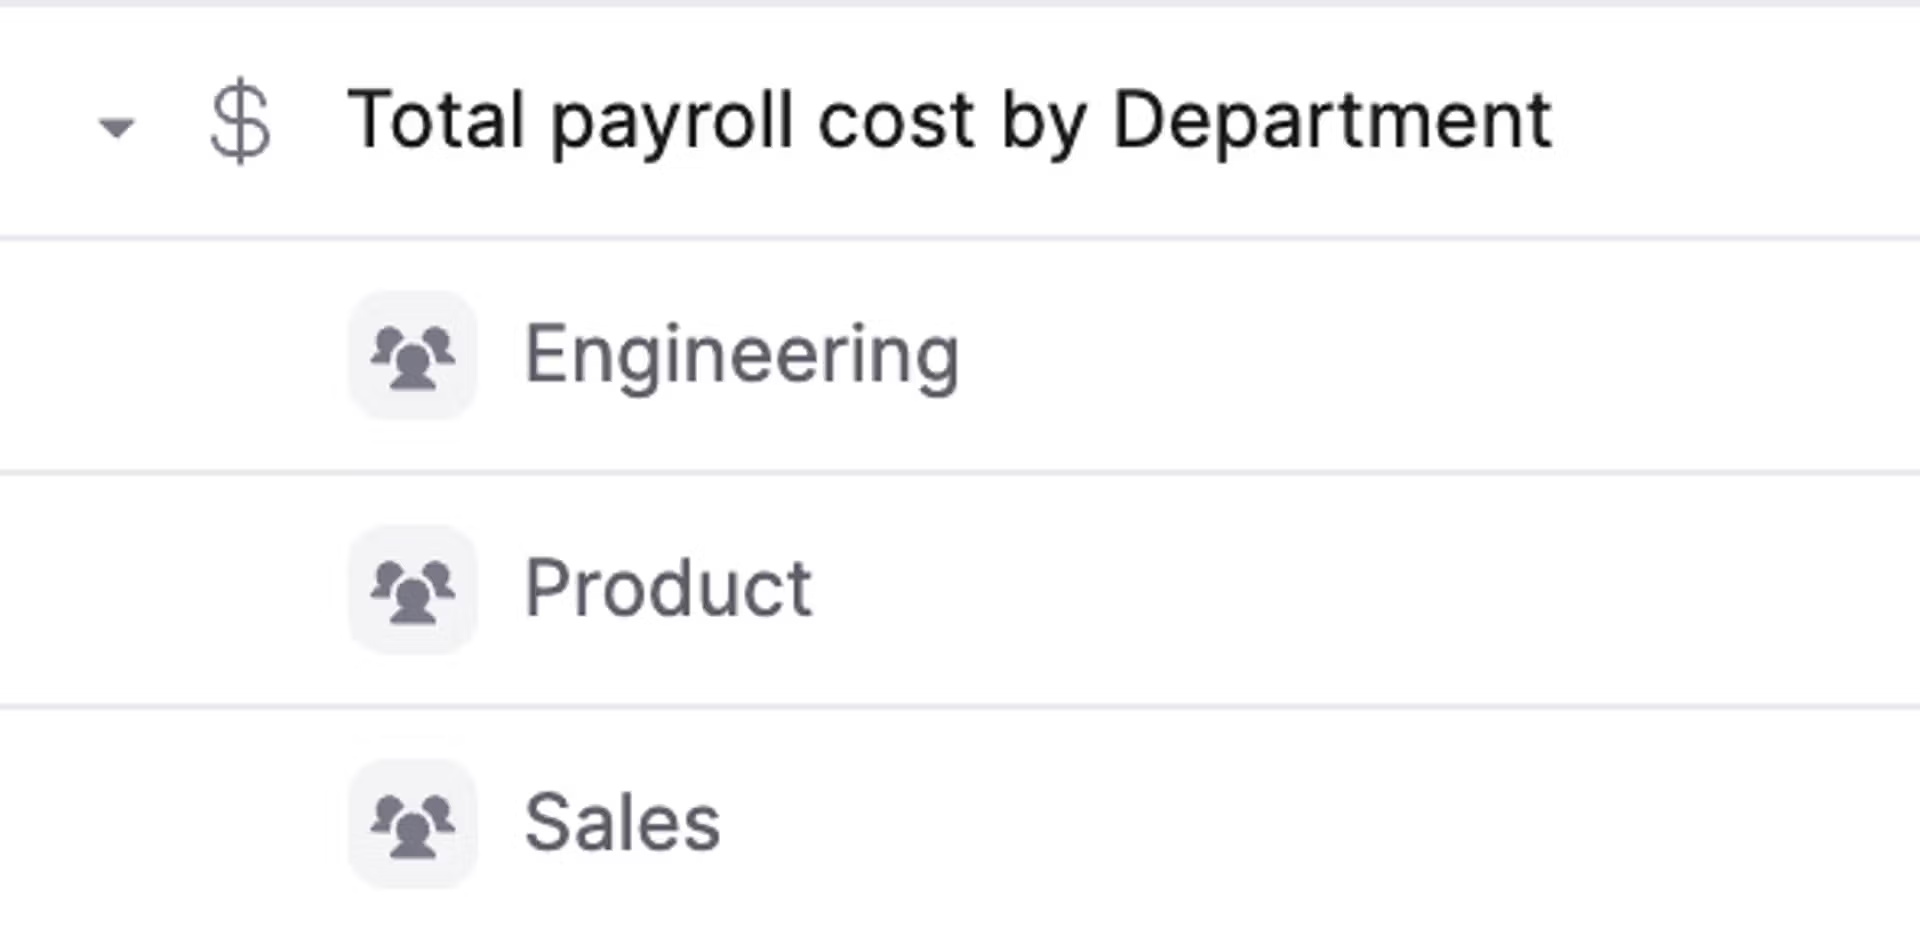
Dimension
Dimensions are a way to organize and manage data within a model. They are useful when you have a concept that's broken down.
Examples:
- Number of customers (variable) broken down by Geography (dimension)
- Revenue (variable) broken down by Product (dimension)
- Ad spend (variable) broken down by Marketing Channel (dimension)
View
Views let you create saved filters on your model, to show only specific variables, dimension items, scenarios, time periods, and charts.
Users with the Viewer role can create their own private models that are only visible to them.