Functions in the Detail View
Last updated on 2026-04-22
Overview
This article gives an overview of the general functions that are available in the detail view of Consolidation & Financial Planning.
This article contains the following sections:
Highlighting Elements or Formatting Elements Bold
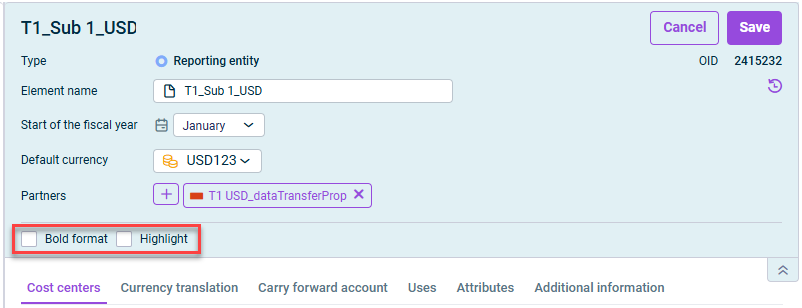
You can use the options Bold format and Highlight to flag certain elements in the tree view of Consolidation & Financial Planning.
To do so, navigate to the detail view of the desired element, open editing mode, and activate the Bold format and/or Highlight check box.
Which of these formatting options are available depends on the workspace you work in.
To format elements in bold or highlight them, you need write permissions for the respective workspaces. You can assign read and write permissions in the User management workspace of the Lucanet CFO Solution Platform (see Creating and Editing Users for the Lucanet CFO Solution Platform).
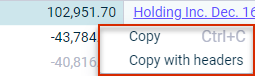
Copying Columns
In Consolidation & Financial Planning, column contents in ledgers and schedules can be copied and reused else where. To do so, navigate to the desired table column and copy the column to the clipboard with a right click | Copy or Copy with headers.
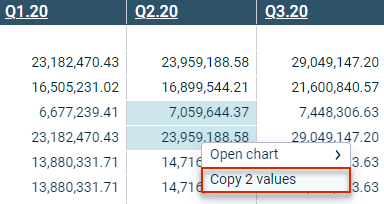
Copying Values
The Copy values context menu command can be used in Consolidation & Financial Planning to copy values to a different point within or outside the Lucanet software. To do so, navigate to the desired table value and copy the value to the clipboard with a right click | Copy values. Keep the CTRL key pressed to copy several values simultaneously.
To copy all values of a column simultaneously, you can click the column header. This automatically marks all cells and allows them to be copied.
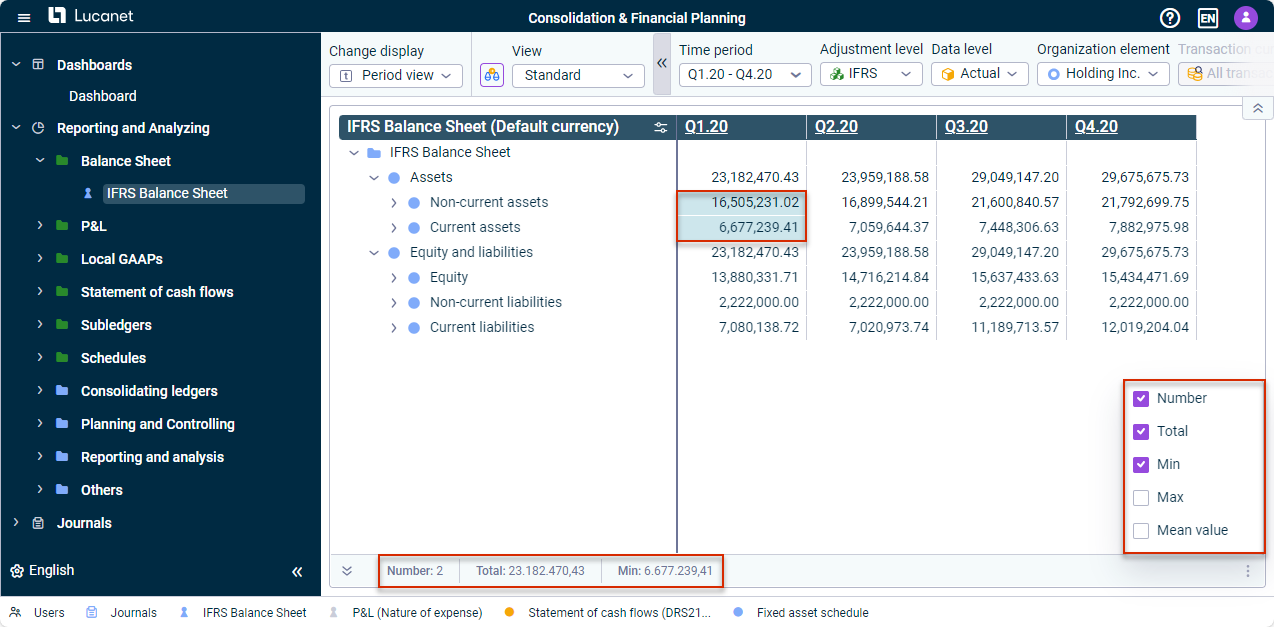
Calculating the Total and Minimum, Maximum, and Mean Values
In Consolidation & Financial Planning, you can view the total and the minimum, maximum, and mean values of certain values, such as values from the balance sheet on the status bar or values in the Show postings dialog. Select the desired values to display the total on the status bar. Click the three dot icon ![]() to display the minimum, maximum and mean values.
to display the minimum, maximum and mean values.