Dimensionen verwenden
Zuletzt aktualisiert am 03.11.2025
Überblick
Dimensionen sind das umfassendste Konzept von xP&A. In diesem Artikel wird das Konzept von Dimensionen erläutert, damit Sie diese in Ihren Modellen verwenden können.
Dieser Artikel enthält folgende Abschnitte:
- Eine Dimension ist im Grunde eine Liste
- Mit Dimensionen können Sie Ihre Variablen aufschlüsseln
- Dimensionen in Formeln verwenden
- Dimensionen können live bearbeitet werden
- Dimensionen können Hierarchien haben (Ebenen)
- Dimensionen können Typen zugewiesen werden
- Dimensionen können miteinander verknüpft werden
- Dimensionen erleichtern das „Nachschlagen“
- Dimensionen ermöglichen einfaches Segmentieren und Filtern in Diagrammen und Tabellen
- Dimensionswerte können überschrieben werden
Eine Dimension ist im Grunde eine Liste
Angenommen, Sie erstellen ein Finanzmodell für Ihren Kaffee-Onlineshop. Sie verkaufen 10 verschiedene Produkte (SKU), jeweils mit einem eigenen Preis.
In xP&A können Sie eine Dimension mit der Bezeichnung SKU erstellen, in der jedes Produkt ein eigenes Element ist:
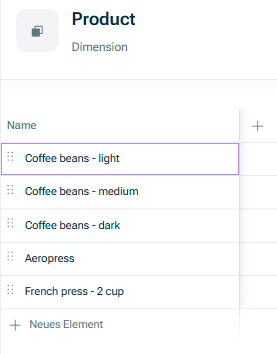 Dimension 'SKU' mit Dimensionselementen
Mit Dimensionen können Sie Ihre Variablen aufschlüsseln
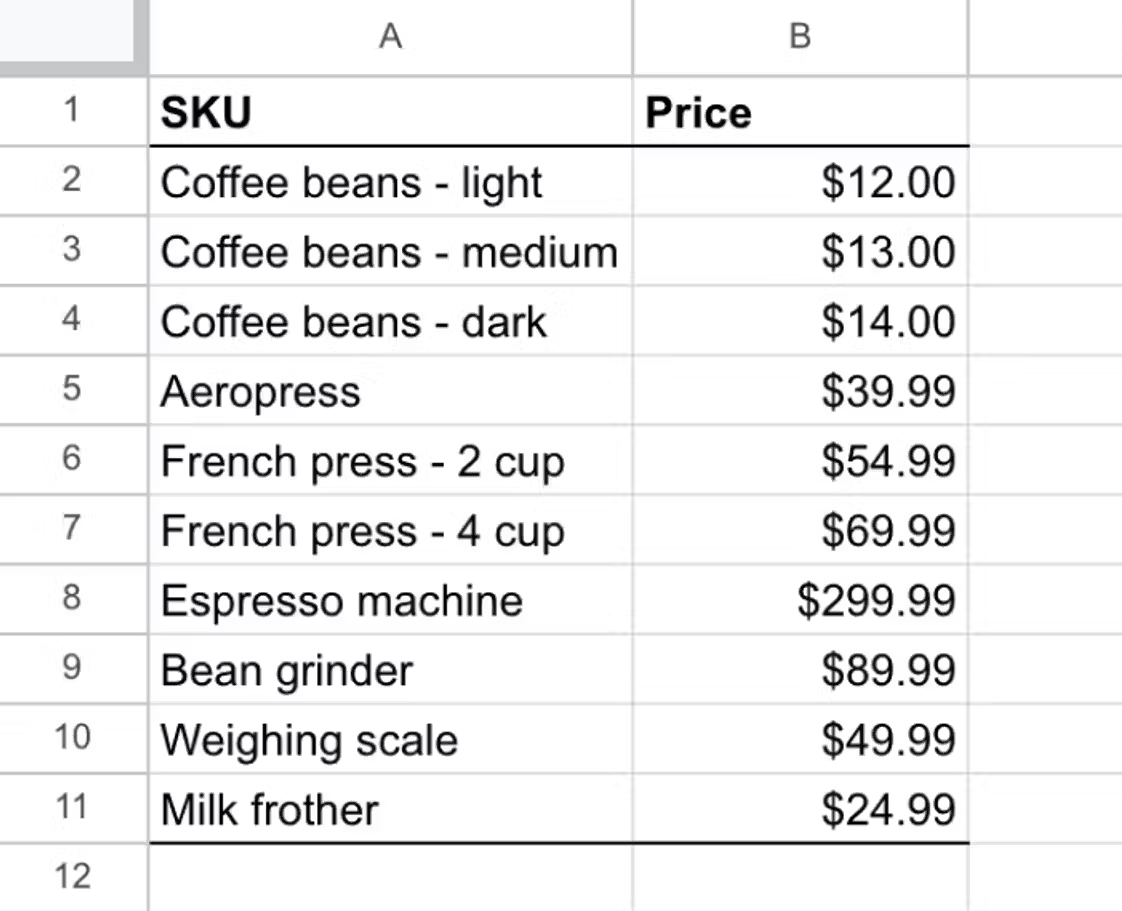
In einem Spreadsheet würde es sich anbieten, eine Zeile für jedes Produkt mit einer Spalte für den Preis zu erstellen:
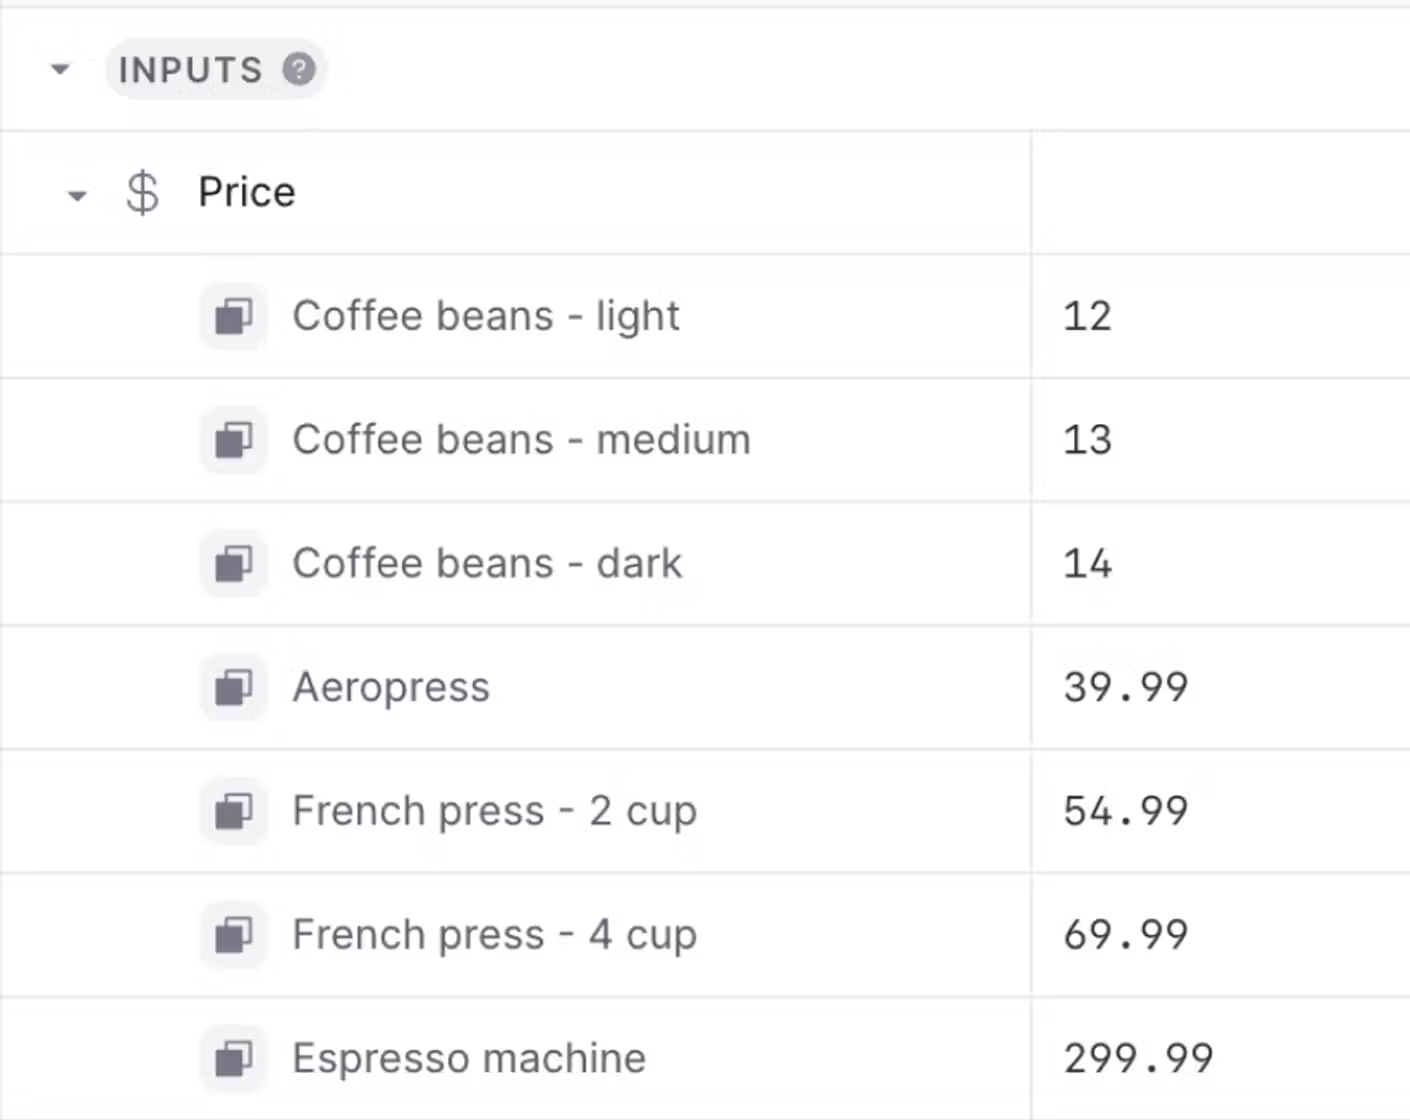
In xP&A können Sie eine einzelne Variable Price (Preis) erstellen, die nach der Dimension SKU aufgeschlüsselt ist:
Dimensionen in Formeln verwenden
Angenommen, Sie müssen auf jeden Verkauf 20 % Steuern entrichten und möchten Ihre Brutto-Erlöse für jedes Produkt berechnen.
In einem Spreadsheet müssten Sie 10 neue Zeilen erstellen und für jedes Produkt eine eigene Berechnung durchführen.
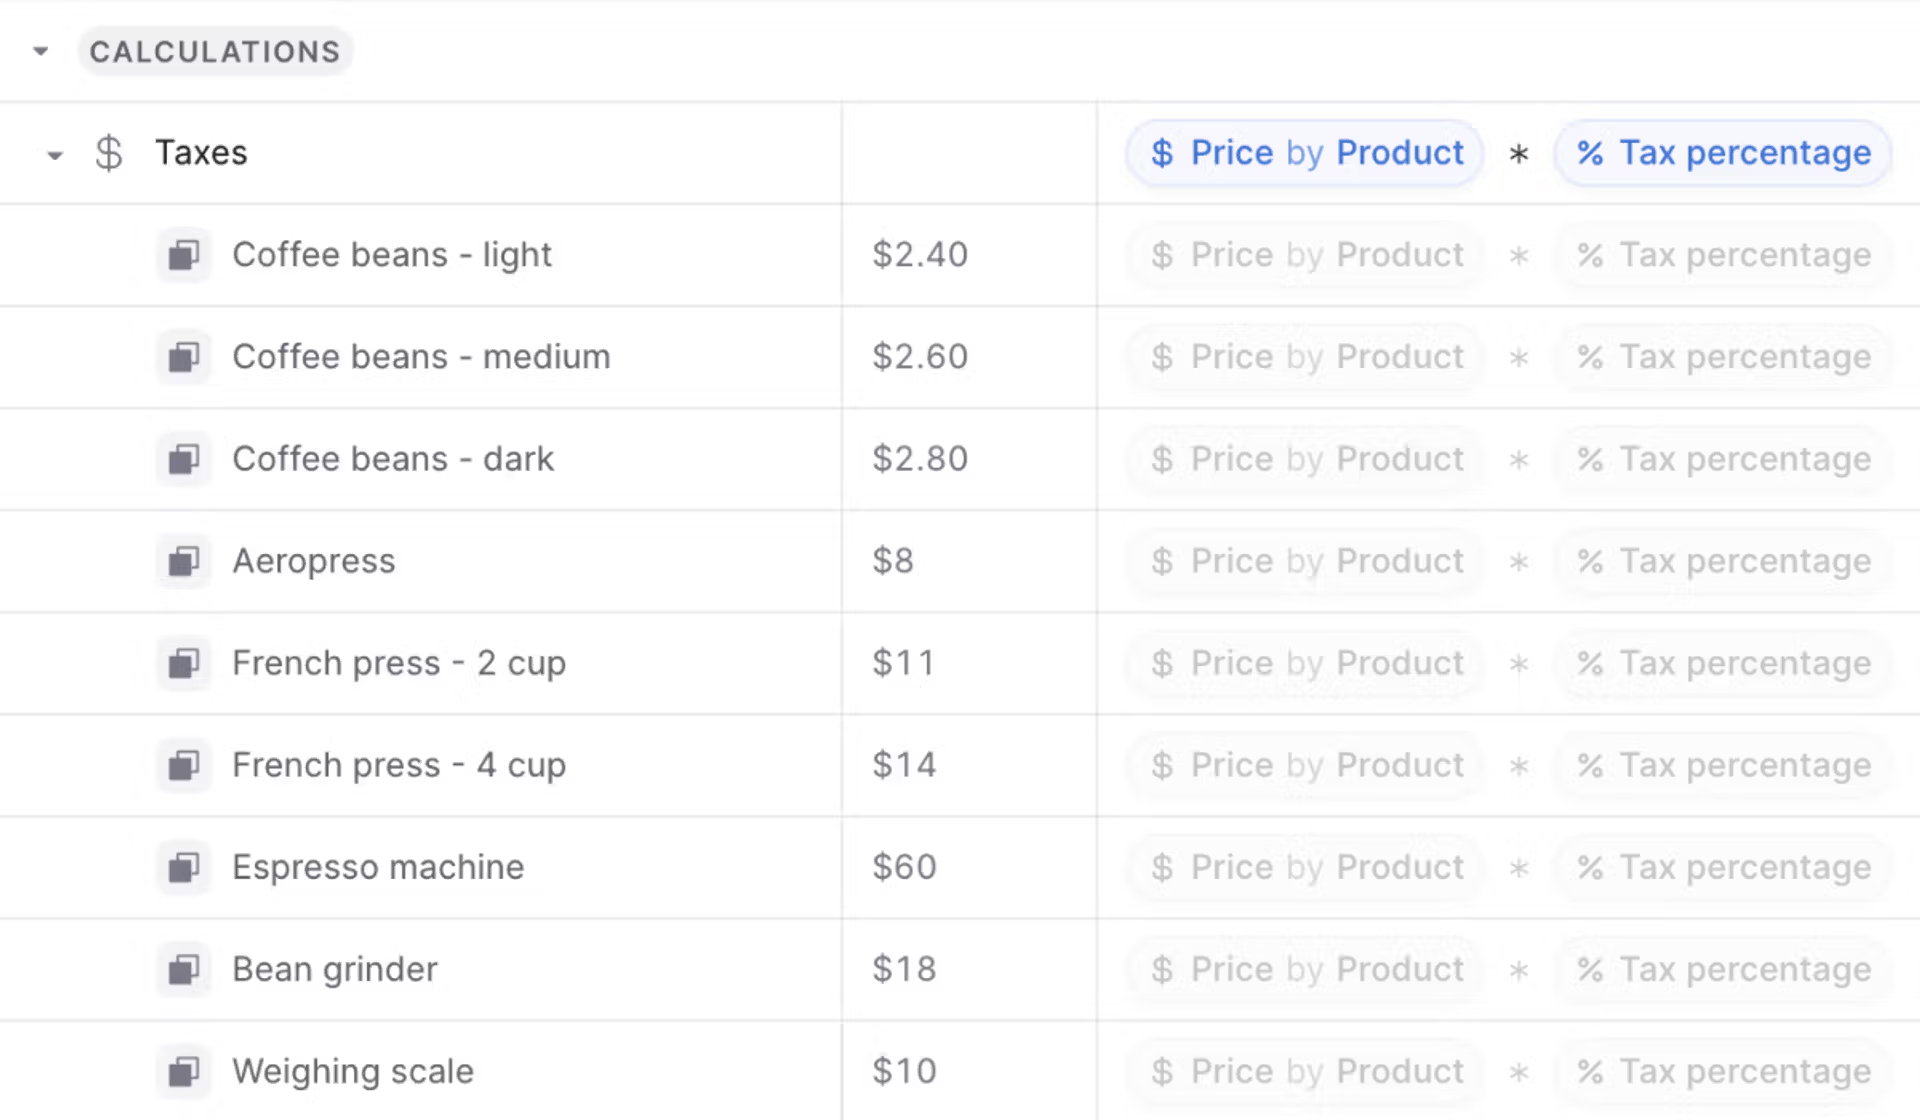
In xP&A hingegen müssen Sie die Berechnung nur einmal vornehmen, und xP&A wird das Ergebnis für jedes Dimensionselement automatisch einzeln berechnen.
Dimensionen können live bearbeitet werden
Angenommen, Sie nehmen ein neues Produkt in Ihr Angebot auf.
In einem Spreadsheet müssten Sie jede Stelle Ihrer Produktliste in Ihrem Modell suchen, jeweils eine neue Zeile an der richtigen Stelle einfügen und dann die korrekte Formel eingeben.
In xP&A können Sie Ihr neues Produkt einfach zu Ihrer Dimension SKU hinzufügen, und xP&A wird es automatisch überall dort berücksichtigen, wo diese Dimension verwendet wird.
Dimensionen können Hierarchien haben (Ebenen)
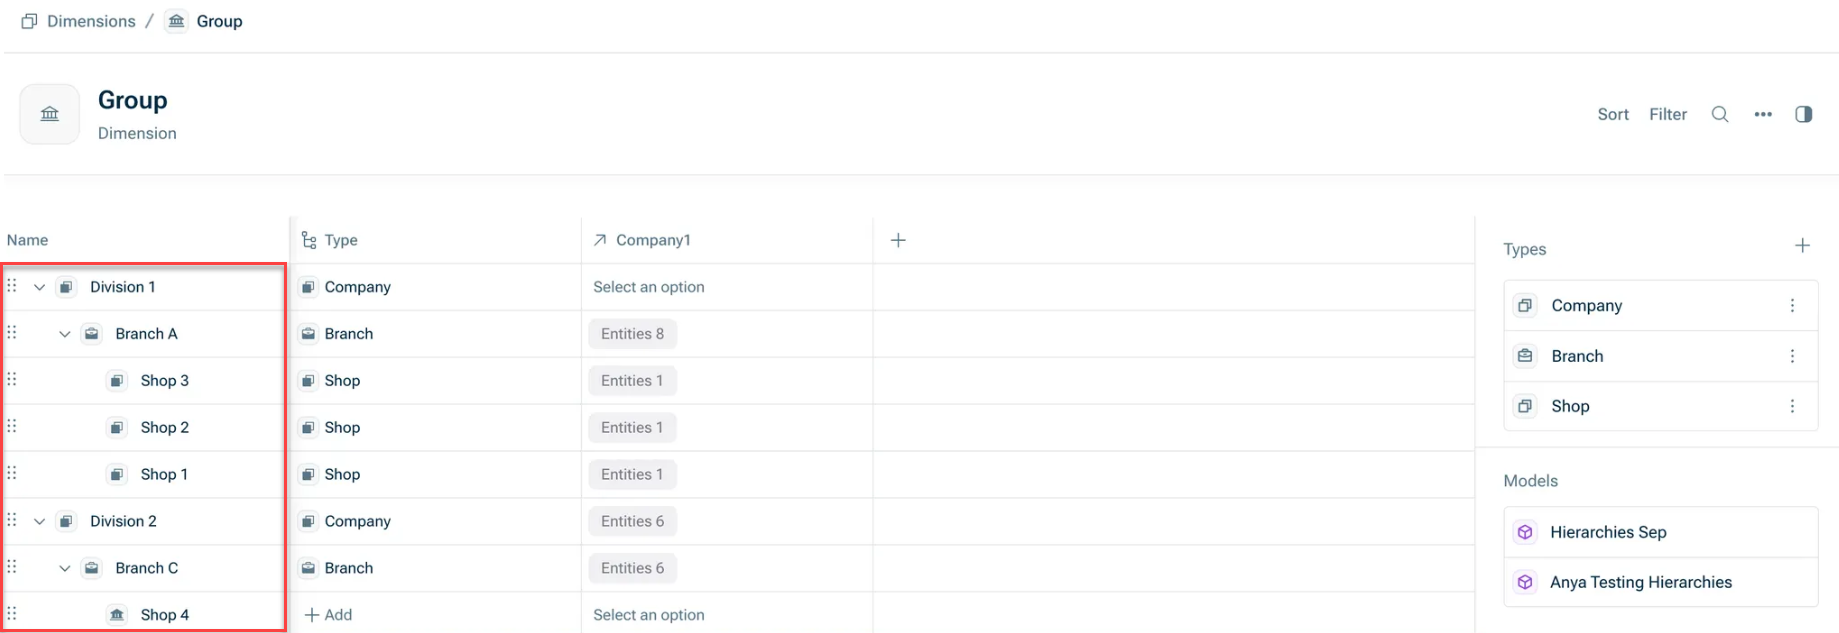
Wenn Ihre Dimension eine feste Hierarchie hat, z. B. wenn Ihre Dimension Gruppe lautet und Abteilungen, Niederlassungen und Shops enthält, die zusammengefasst sind, können Sie Ihre Dimension so aufbauen, dass Daten auf der entsprechenden Ebene angezeigt und aggregiert werden.
Um diese Hierarchie in den Dimensionseinstellungen darzustellen, klicken Sie einfach ein Dimensionselement auf der linken Seite an und ziehen Sie es per Drag&Drop unter die Dimension, zu der es gehört. Dadurch werden automatisch Ebenen zugewiesen (oberste Elemente sind Ebene 1, ihre untergeordneten Elemente Ebene 2 usw.). Weitere Informationen finden Sie unter Dimensionen erstellen und bearbeiten.
Im folgenden Beispiel ist Division 1 Ebene 1, Branch A Ebene 2 und Shop 1, 2 und 3 Ebene 3:
Dimensionen können Typen zugewiesen werden
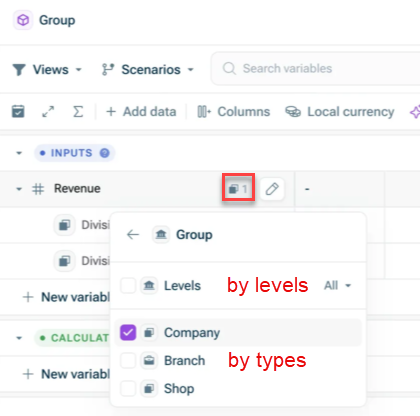
Zusätzlich zu Ebenen können Dimensionen auch Typen umfassen, d. h. Klassifizierungen, die Sie Dimensionselementen zuweisen können. Typen können, müssen aber nicht mit Ebenen übereinstimmen. Z. B. könnten Sie einen Typ Shop haben, wobei Shop 5 und Shop 6 unter Shop 4 gruppiert sind.
In Modellen können Sie Dimensionen entweder nach Typen oder nach Ebenen gruppieren. Weitere Informationen finden Sie unter Dimensionen erstellen und bearbeiten.
Dimensionen können miteinander verknüpft werden
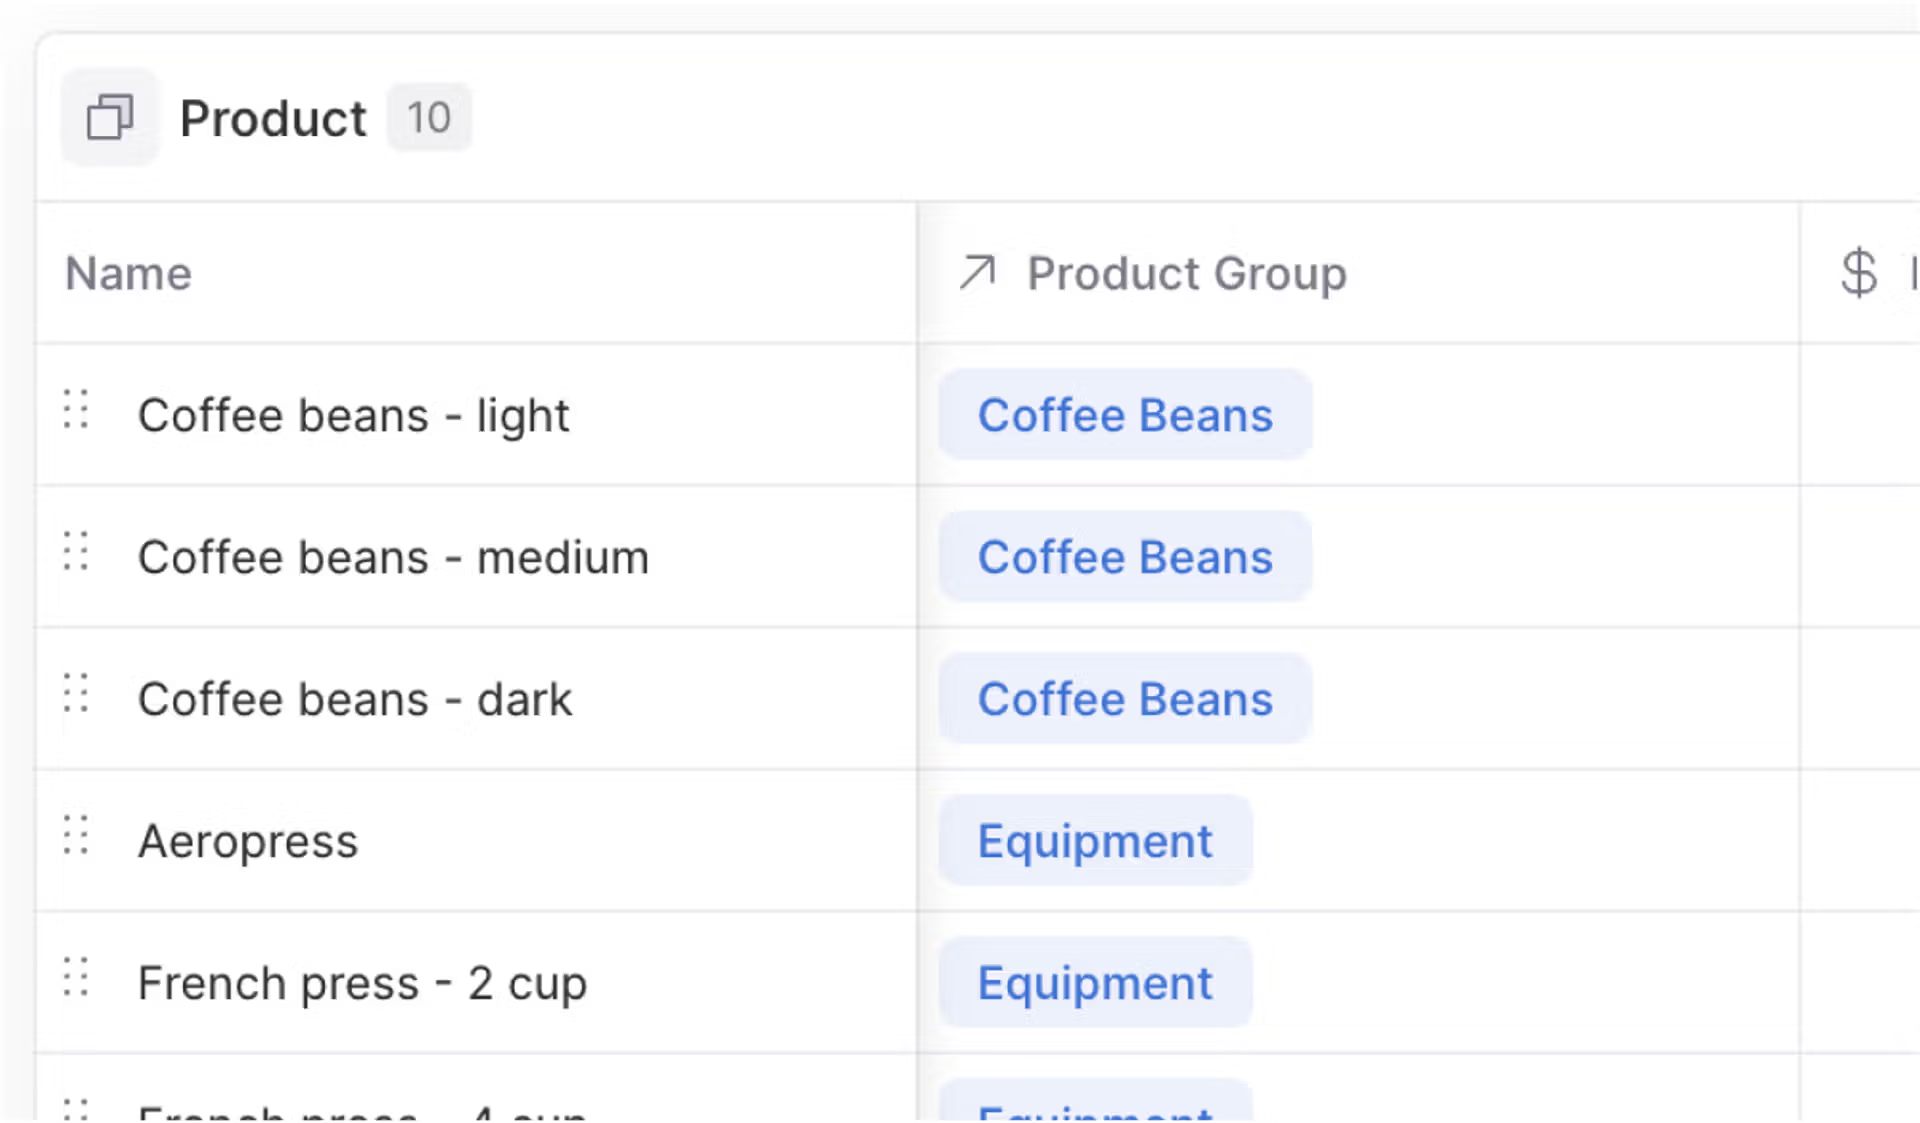
Sie überlegen, Ihre Produkte in zwei verschiedene Gruppen aufzuteilen: Coffee beans (Kaffeebohnen) und Coffee equipment (Kaffeezubehör).
In xP&A können Sie eine Dimension namens Product Group (Produktgruppe) erstellen, diese mit der Dimension SKU verknüpfen und dann jede SKU einer Product Group (Produktgruppe) zuordnen:
Dimensionen erleichtern das „Nachschlagen“
Nehmen wir an, dass der Steuersatz nicht pauschal 20 % beträgt, sondern für Lebensmittel (z. B. Kaffeebohnen) ein anderer Steuersatz als für Kaffeezubehör gilt.
In einem Spreadsheet würden Sie Folgendes tun:
- Eine Nachschlagetabelle zwischen SKU und Product Group (Produktgruppe) einrichten
- Separate Steuersätze für jede Product Group (Produktgruppe) einrichten
- Ihre Formeln zur Steuerberechnung durch SVERWEIS (oder ähnliches) ersetzen, um den richtigen Steuerbetrag für jedes Produkt zu verwenden
In xP&A können Sie einfach die Aufschlüsselung Product Group (Produktgruppe) auf Ihre Variable Tax (Steuer) anwenden, und xP&A wird automatisch in allen folgenden Berechnungen den richtigen Steuerbetrag für jedes Produkt verwenden.
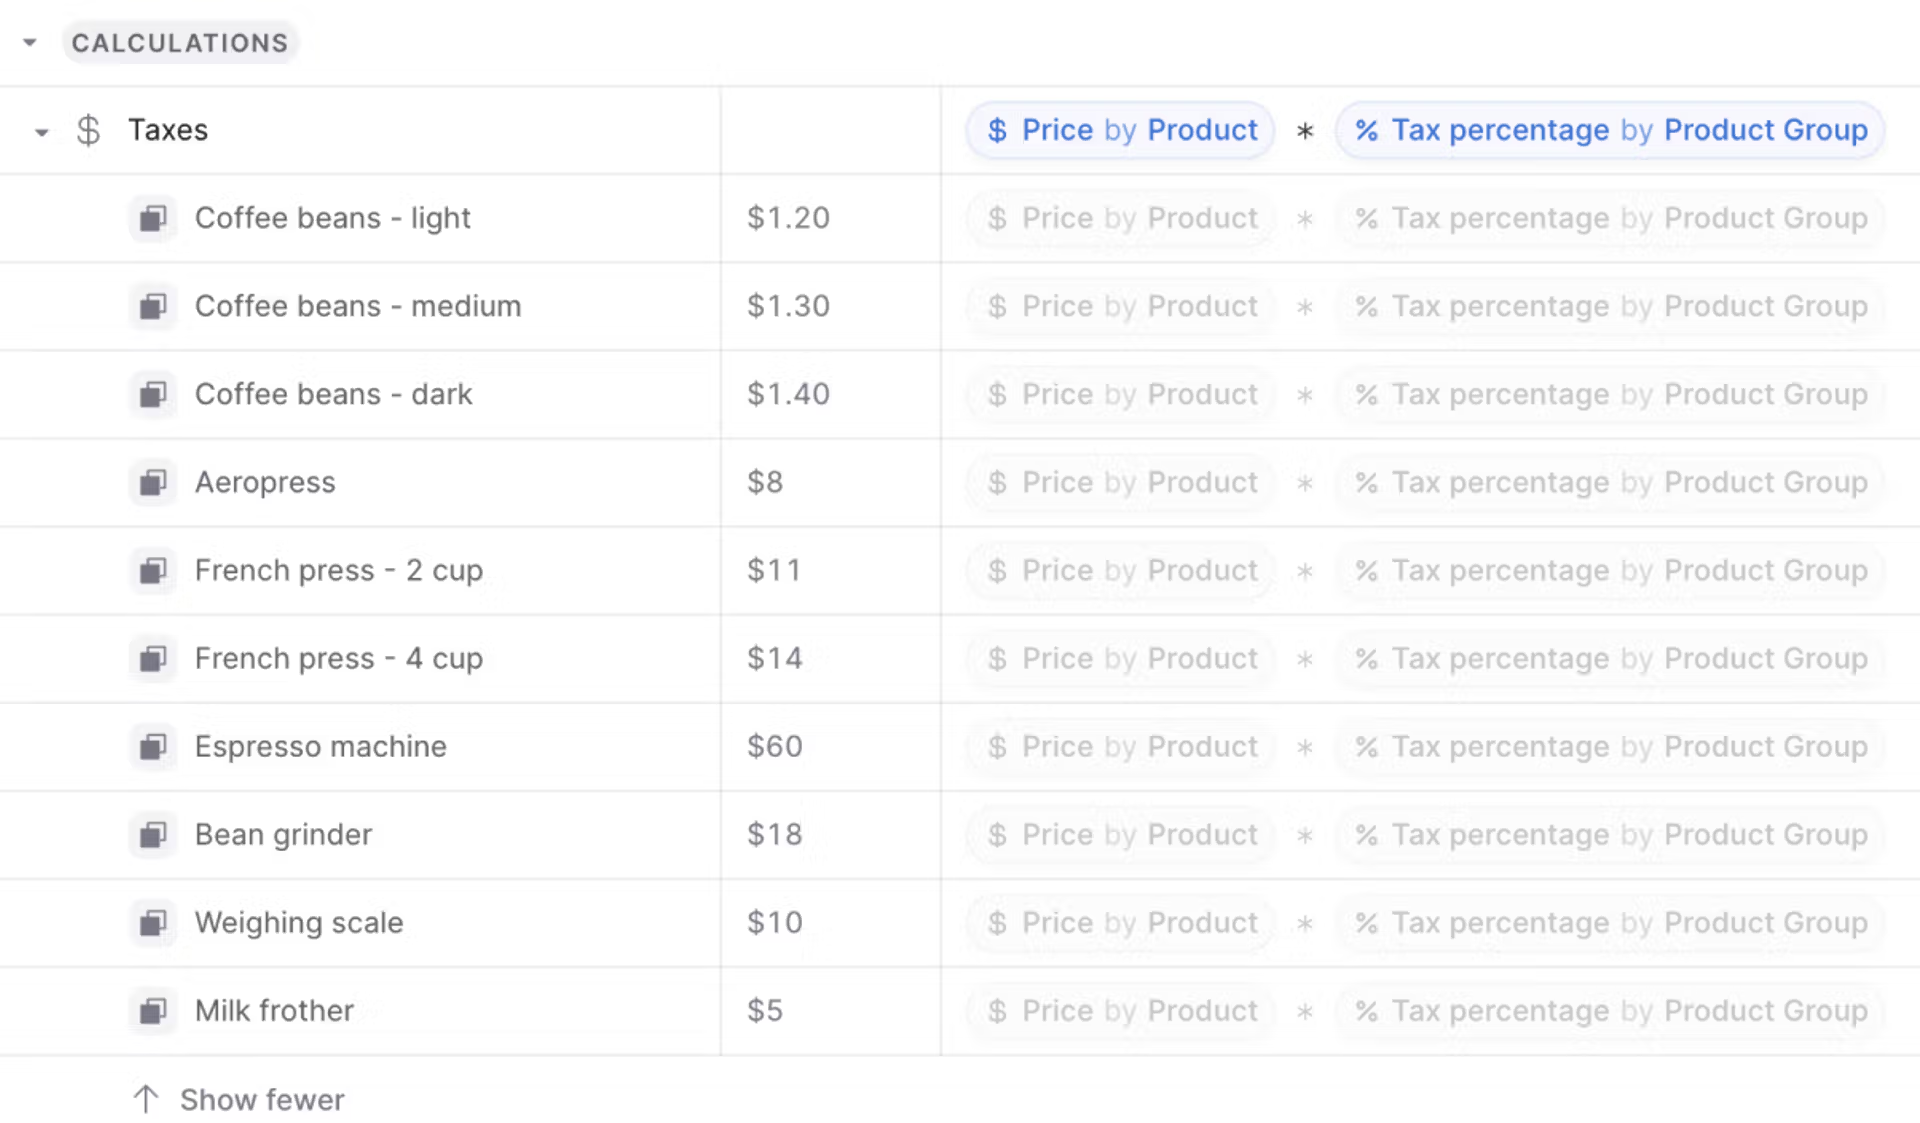
Price (Preis) ist nach Product (Produkt) aufgeschlüsselt, während Tax percentage (Steuersatz) nach Product Group (Produktgruppe) aufgeschlüsselt ist, aber mit xP&A können Sie beides direkt multiplizieren, ohne manuell nachschlagen zu müssen.
Dimensionen ermöglichen einfaches Segmentieren und Filtern in Diagrammen und Tabellen
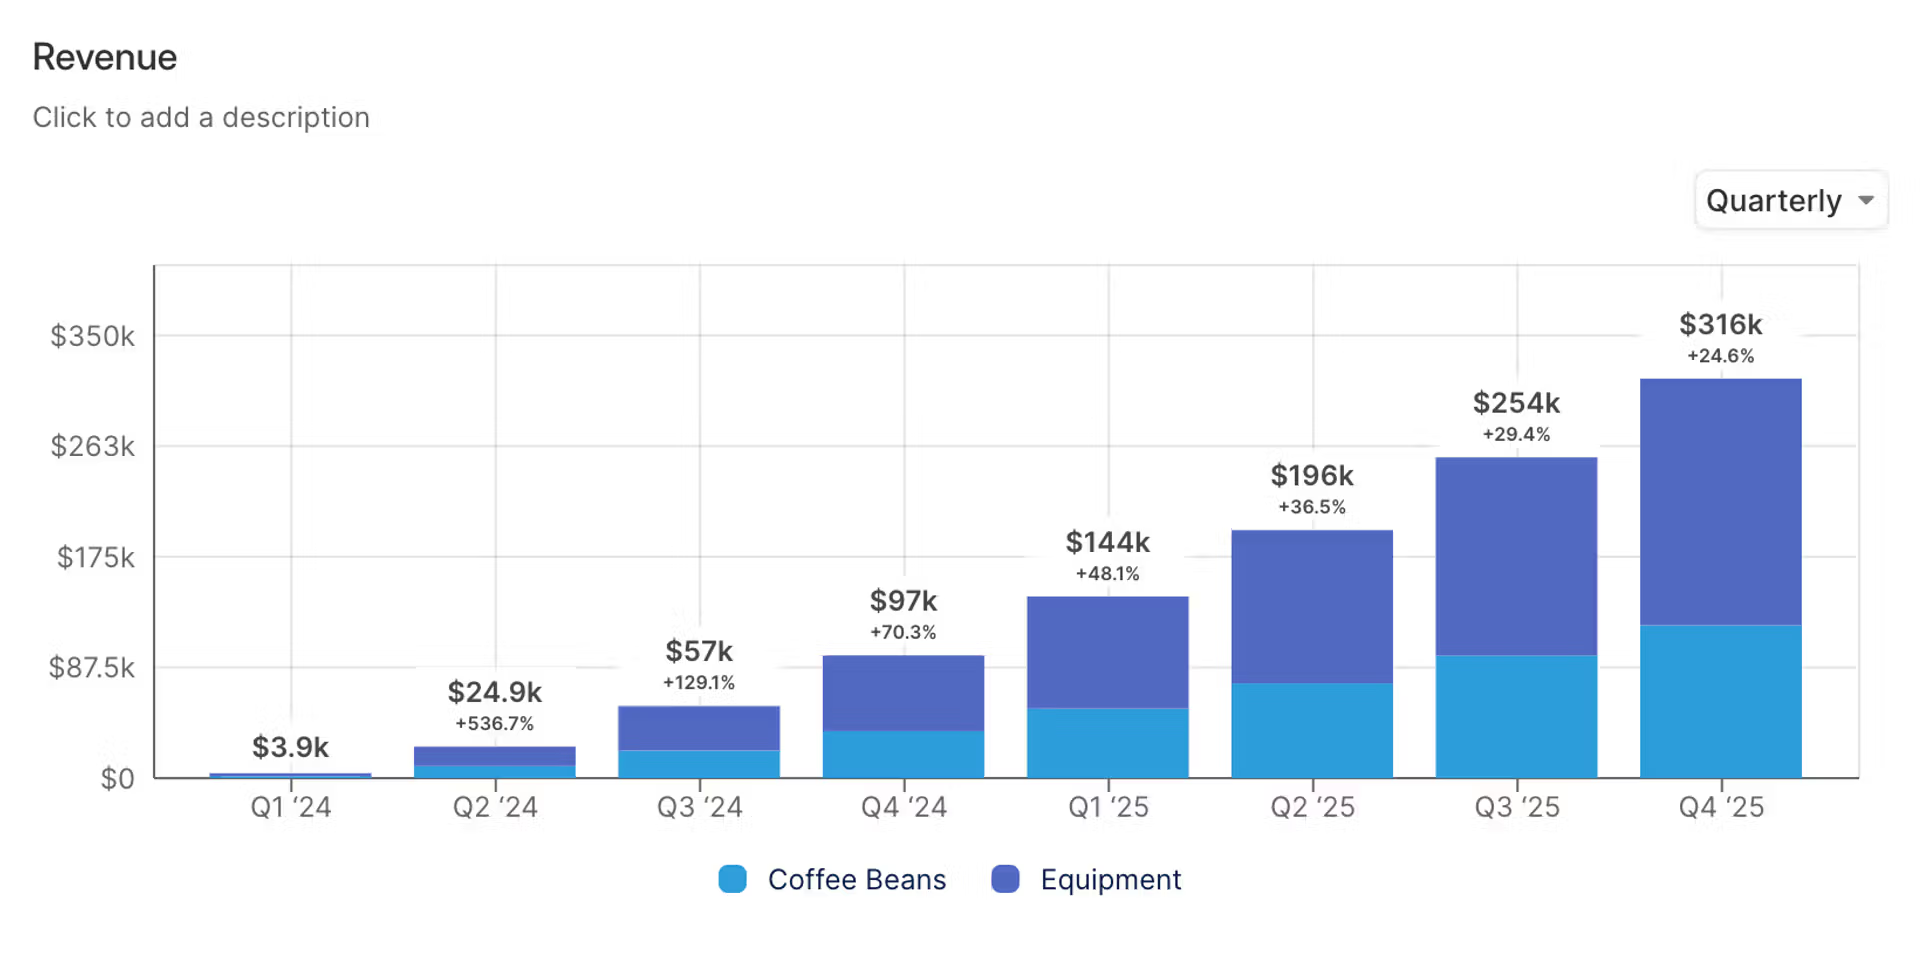
Angenommen, Sie haben Ihren monatlichen Umsatz nach SKU aufgeschlüsselt und möchten ein Gestapelte-Balken-Diagramm erstellen, das Ihre monatlichen Erlöse nach Product Group (Produktgruppe) aufschlüsselt.
In einem Spreadsheet müssten Sie Ihre Daten zunächst „pivotieren“ (mittels Formeln und Kopieren/Einfügen) und anschließend die pivotierten Daten darstellen.
In xP&A können Sie einfach ein Diagramm Ihrer Variable Revenue (Erlöse) erstellen und die Daten dann direkt im Diagramm ohne weitere Konfiguration pivotieren.
Dimensionswerte können überschrieben werden
Es läuft nicht immer alles genau nach Plan – manchmal muss man bestimmte Werte hart kodieren oder unterschiedliche Formeln für verschiedene Zeiträume festlegen.
Sie können jeden Dimensionswert überschreiben, indem Sie einfach auf die entsprechende Zelle klicken und diese bearbeiten. Dieser praktische „Notausgang“ sollte allerdings nur sparsam eingesetzt werden.