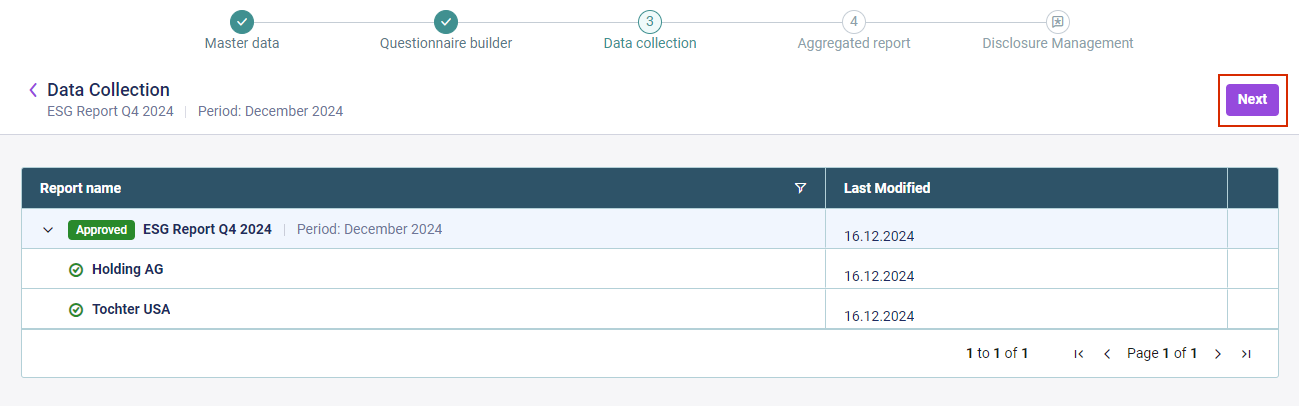
As an ESG Administrator, once you have approved the data submitted by all your reporting entities for an ESG report, you can generate the ESG report containing the individual reporting data for the assigned reporting entities and the aggregated numerical data. The aggregated data are also prepared for the import into the Lucanet Disclosure Management solution for further processing .
Depending on the element type, you have the following options to view detailed responses:
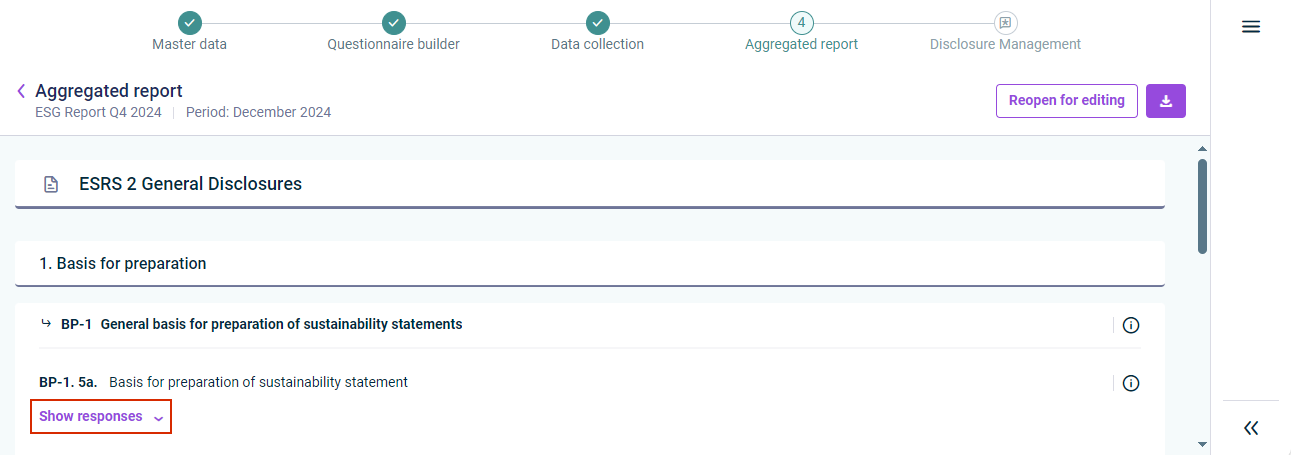
In general, you can use Show responses to view which reporting entity has provided which response for every question in the questionnaire:
Option to show responses for each reporting entity
For responses in the form of radio buttons, you can click Show explanation to access the explanation of the data collectors for their answer.
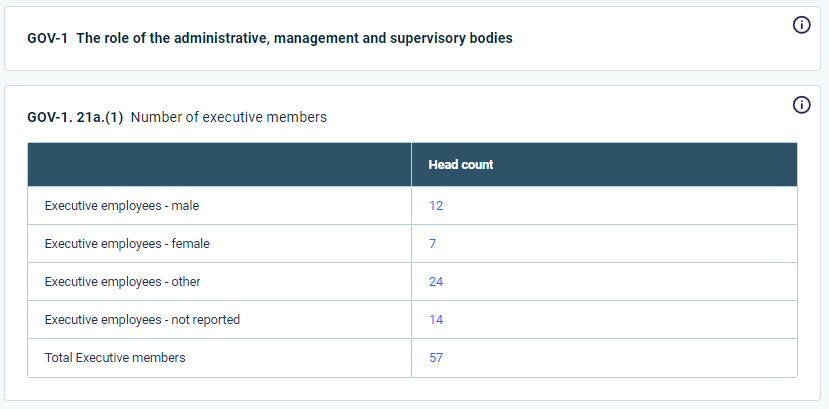
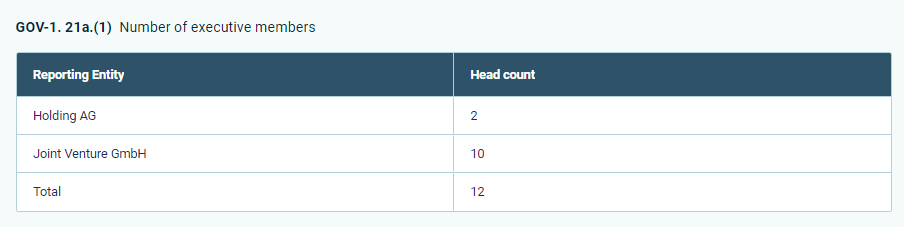
For responses provided in the form of data in tables, a table with the aggregated data is directly displayed. By double-clicking a cell with aggregated values, you can drill down to the individual values entered by each reporting entity:
Aggregated responses displayed in a table
Drill-down to data entered by individual reporting entities
Any custom questions that the ESG Administrator added to the questionnaire (see Adding Custom Questions) are marked with a Custom badge in the aggregated report. You can show and drill down into their responses in the same way as for standard questions.
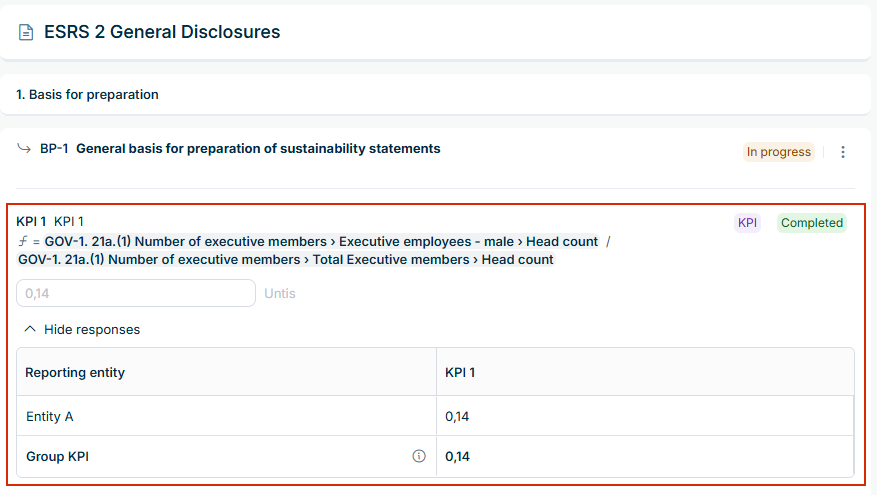
Formula-based KPIs (see Adding Formula-Based KPIs) are marked with KPI in the aggregated report and are displayed with their complete formula. As KPIs are calculated, they are read-only.
Click Show responses to see how the KPI is composed. The table lists every reporting entity with its own KPI value, followed by the Group KPI row:
KPI values per reporting entity and the group value
The group value is not the sum or the average of the individual KPI values. Instead, the input values are first aggregated across all reporting entities, and the formula is then applied to these aggregated values.