Learn how your actual performance compares to your budget or forecast ( Budget vs. Actuals Forecast vs. Actuals See how different scenarios affect your numbers ( Scenario A vs. Scenario B Compare how a new scenario stacks up against your original forecast ( Scenario A vs. Current Forecast
Current Actuals Last Actual Date Rolling Forecast Last Actual Date Data data source

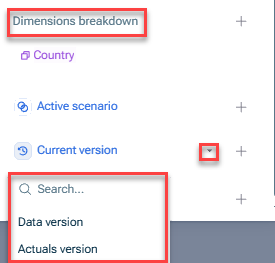
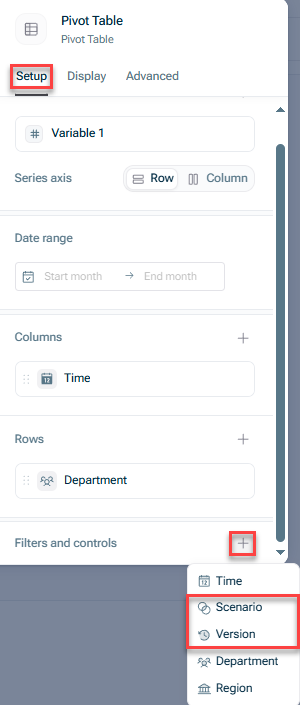
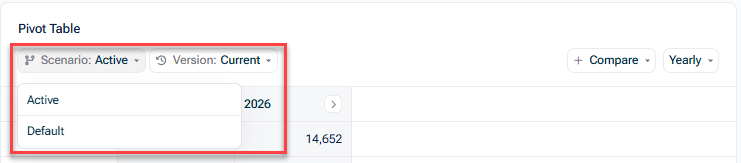
If you want to see the values of another scenario or version only, hover over the selected scenario, open the drop-down menu using the arrow, and choose the desired scenario or version:
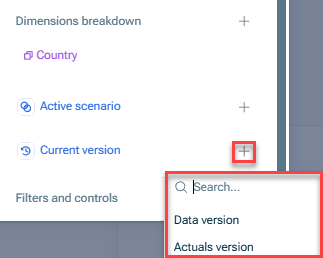
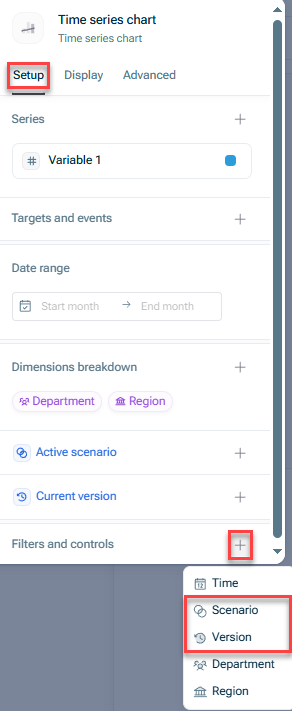
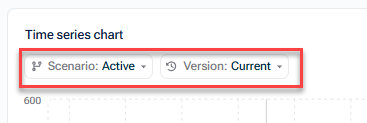
If you want to see the values of another scenario or version additionally to compare them, click the + icon and add the desired scenario or version:
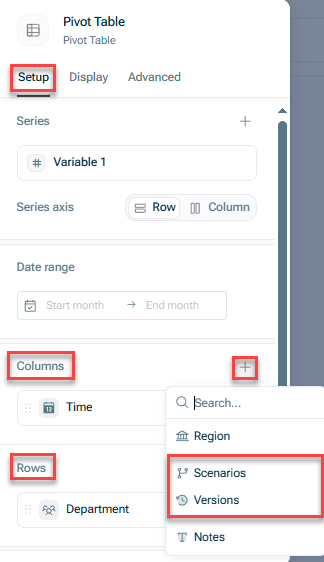
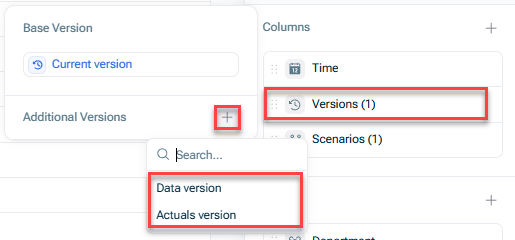
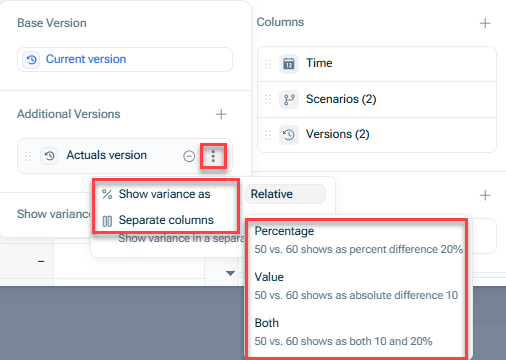
Show variance as percentage value both Show variance in a separate column
This content was generated using AI and reviewed by Lucanet subject matter experts before publication.
Last updated on May 1, 2026