Note that both andStart date are broken down by theEnd date dimension.Employee will have to haveEnd date setting ofEmpty Value (this is the default for variables formatted asNone ).Dates The result is a flag, which returns a for each month that the employee that is active with the company, and1 when they are not.0 The will reflectTotal of all Employees for each month for the company.Total Headcount


The first part of the formula sets the bonus tomonth (1).January ensures employees have been with the company at least 6 months before receiving a bonus.Start Date < date - 6 results in the bonus amount. Multiplying byAnnual Salary * Bonus Target % will ensure that the bonus is paid only if the employee is active (seeHeadcount formula above)Headcount Note that the can be set at Department level, seniority, or any other level depending on how you map your dimensions.Bonus Target %

Simply set a per employee assumption (can be by department, etc.) as a flat rate Multiply that rate by your headcount

Simply apply a to the applicable cost base.% rate Like all inputs, they can be split into dimensions for more granular approaches.

In this approach you can create a variable that applies a % of the annual value over 12 months (7 days, 30 days, etc) so that adding Jan-Dec would add up to 1 or 100%.Seasonality Make sure to set up the variable as relative time.

Then use another input variable for your .Annual Target The resulting formula below uses as themonth - 1 . The -1 aligns xP&A'stime modifier (which starts at 0), with xP&A'stime step index (1-12 for Jan-Dec). Note themonth index is used because this model starts in-1 , if the model was to start in February,January should be applied and so on for other month start dates.-2

The previous approach (% of annual total) divides an annual target throughout the year, whereas this approach adjusts monthly numbers for seasonality. The input in this case, should equalSeasonality for “average” months and 120% or100% for above or below average months, respectively (and versus adding up to 100% for the year in the previous approach).90%

often follow a pattern depending on how many months they've been a customer.Retention and expansion rates may differ depending on what time of year a customer joined.Churn rates may be higher in initial months after sign-up, then drop off.Spend or engagement If you have a new , more customers might retain in the 2nd month, (vs. when there was no new onboarding flow).onboarding flow


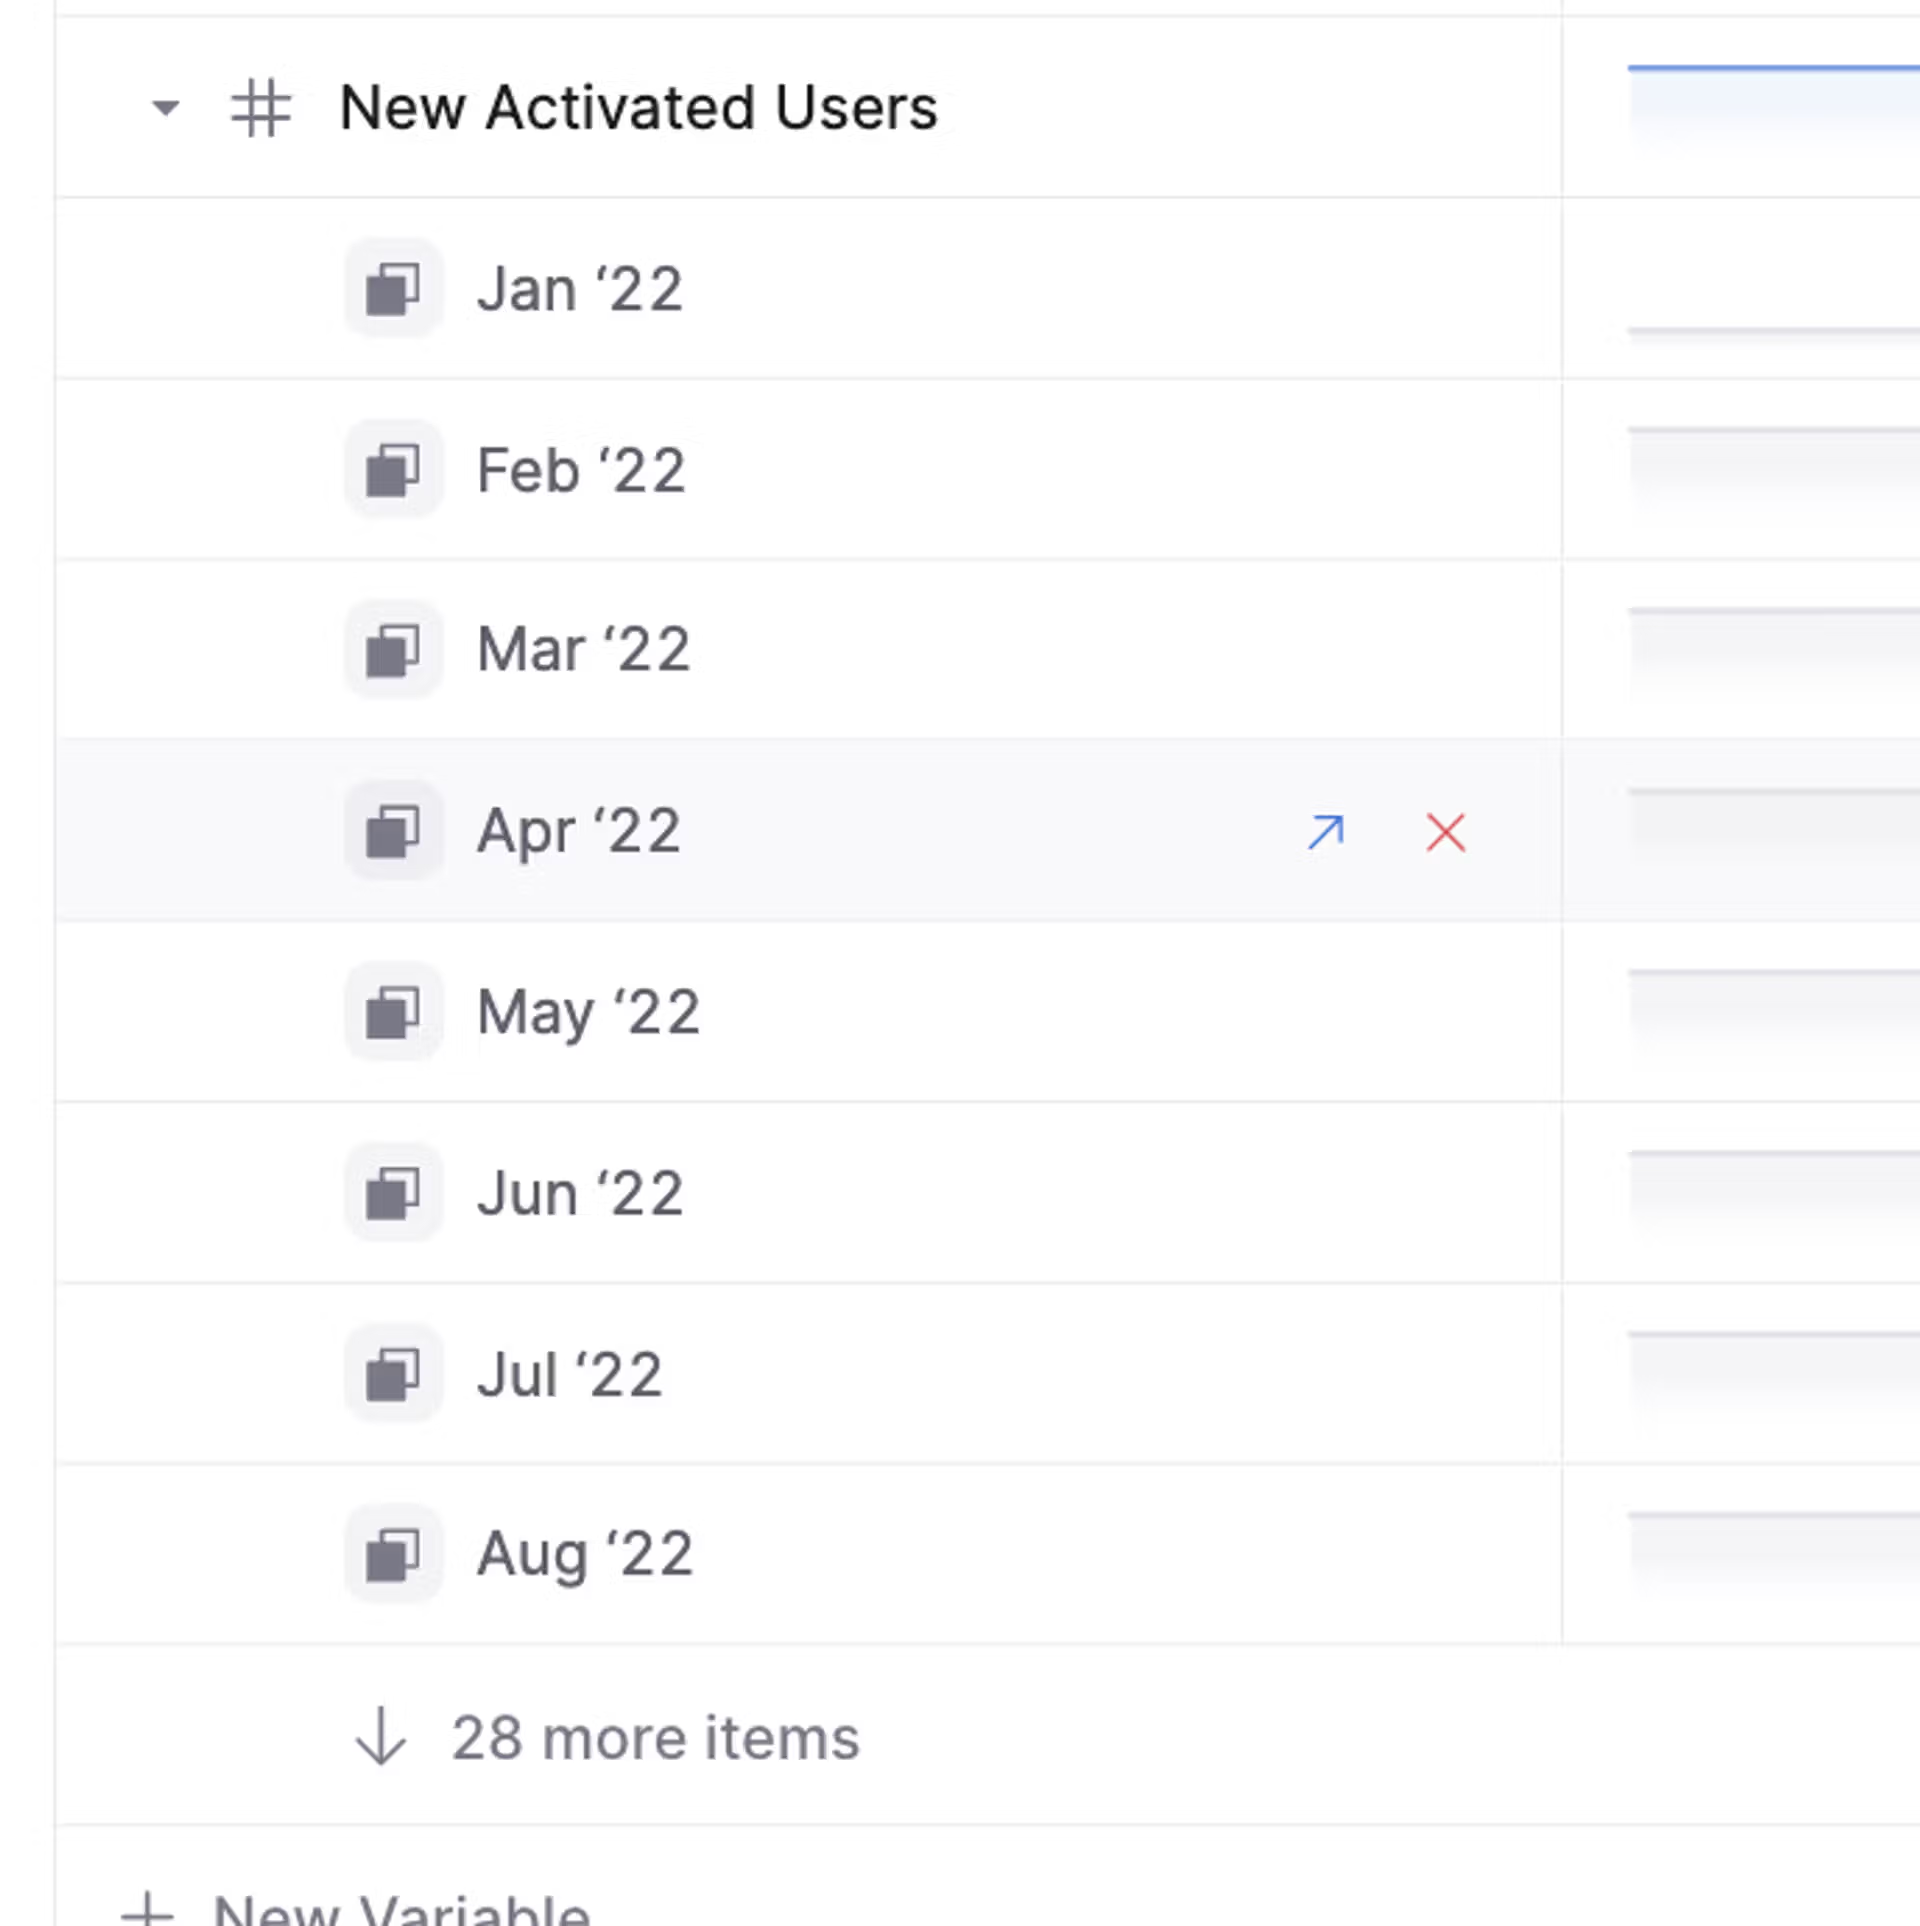
By putting cohort as the of thetime modifier variable, we are telling xP&A to use the new sign-ups for January in theNew sign-ups cohort, February in theJan cohort, etc.Feb By using as the time modifier of thet-cohort variable, we are telling xP&A to use the 1st month activation rate (i.e. 45%) for the first month of the cohort (Jan'22 for the Jan'22 cohort), the second activation rate (25%) for the second month of that cohort (Feb'22 for the Jan'22 cohort), and so on.Activations
iscohort for Jan '22,0 for Feb '22, etc.1 ist for Jan '22,0 for Feb '22,1 for Mar '22 etc.2 For our worked example, ist and2 iscohort .1 will returnt-cohort , so the 2nd month activation rate (1 ) is applied. This is correct as Mar'22 is the 2nd month of my Feb'22 cohort.25% If the month was instead Feb '22, then would bet-cohort corresponding to the 1st month activation rate of **45%0 (1-1)
**
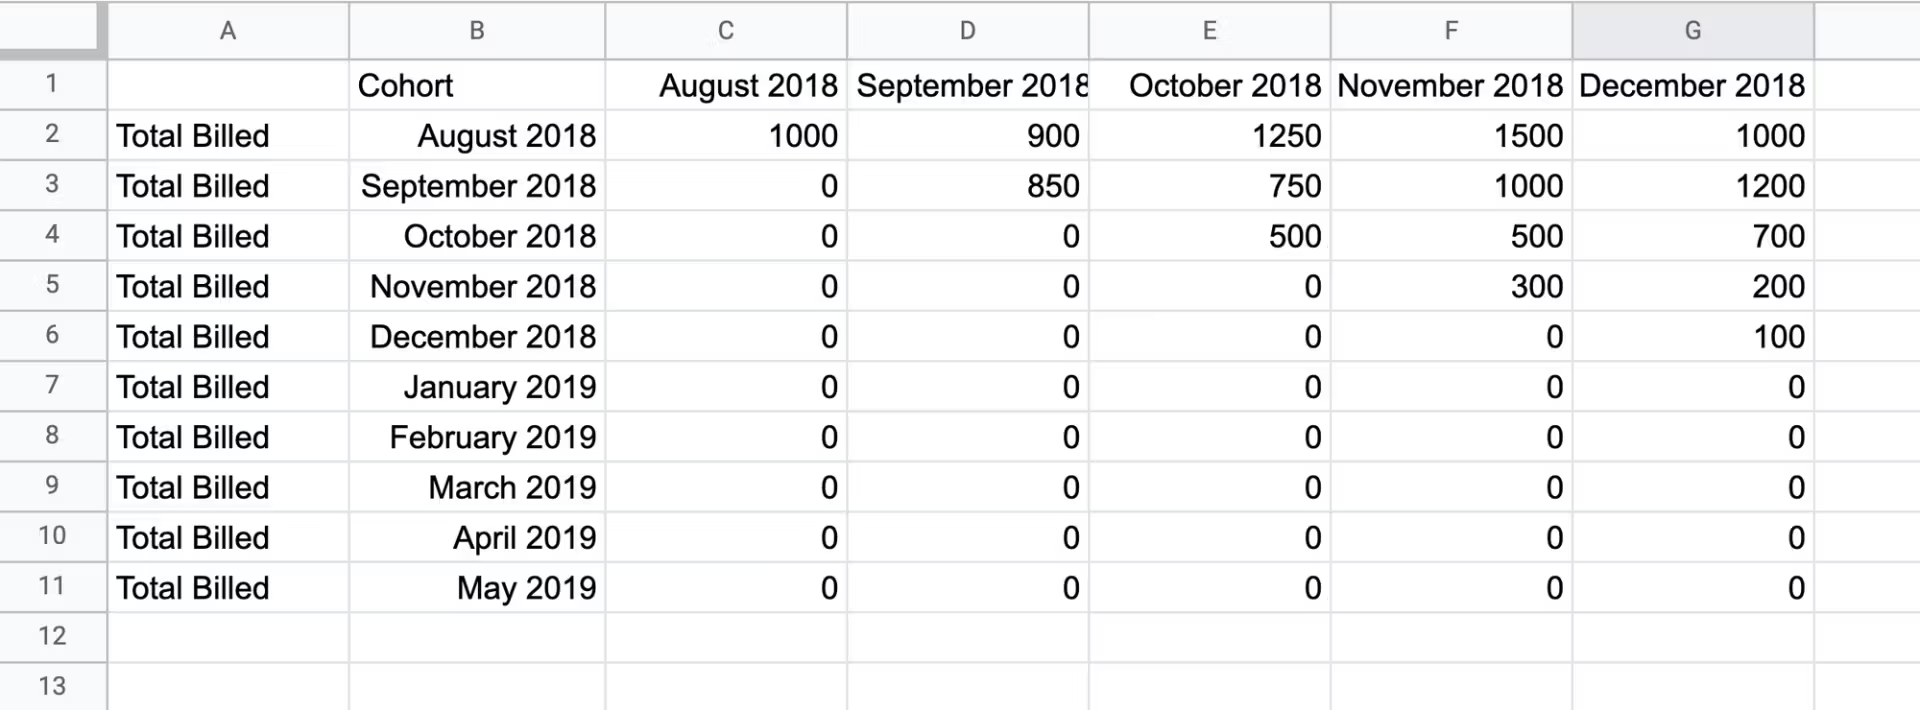
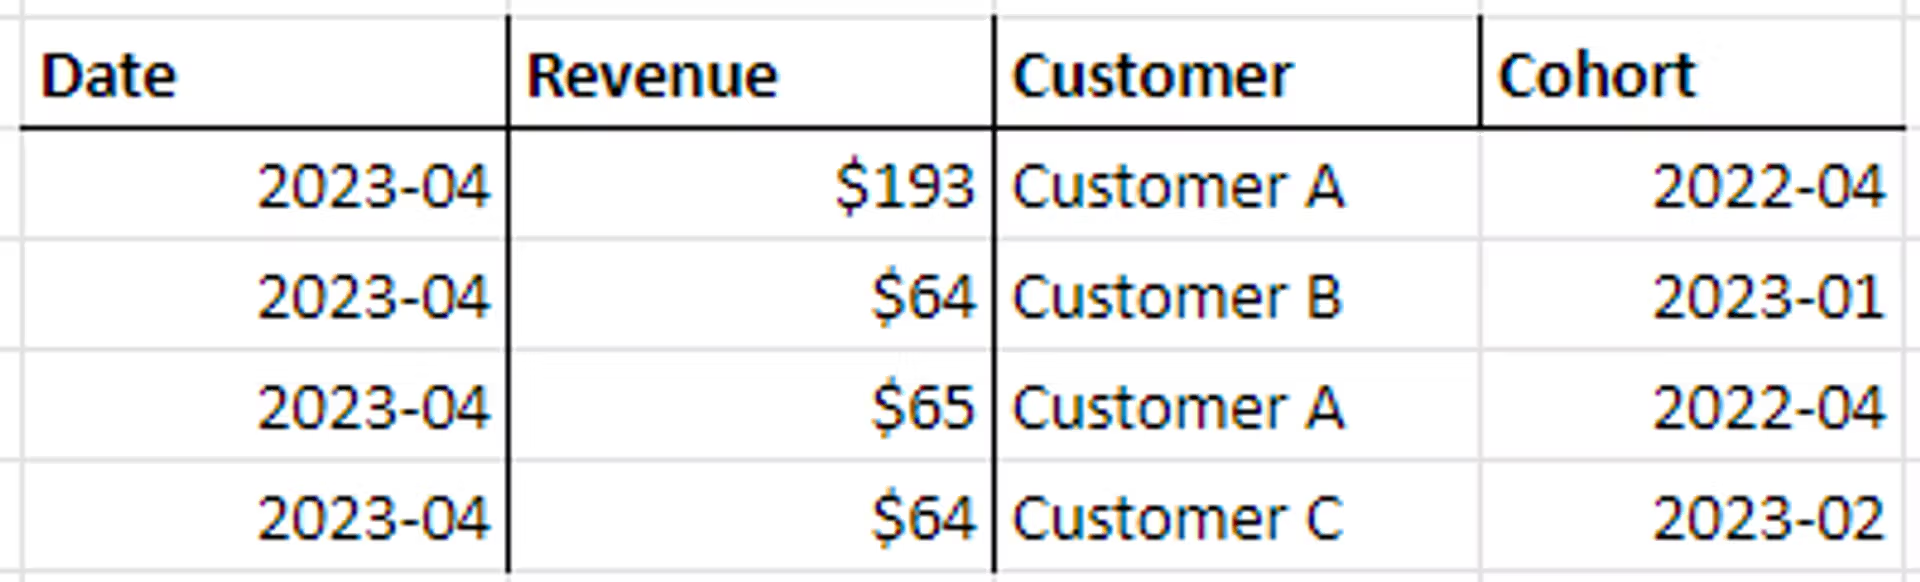
A . If you go the spreadsheet route, there are two formats that are compatible with xP&A:spreadsheet format andTime-Series format. For both, an example can be found below.Transactions

Each row represents a single variable for a single dimension item. The columns can be split into 3 section: ,Variable Names , andDimensions Values The is just the first column:first section It must contain the .Variable Names In the example above, contains the variablecolumn A . In this case, it was the only variable.Total Billed
The proceeds the first column:second section It contains the Dimensions. The first row must have the and the rows below may have thename of the dimension in that dimension.name of an item In the example above, contains thecolumn B dimension. In this case, it was the only dimension. The cohort names (e.g.Cohort ) must be formatted asAugust 2018 to be recognized by xP&A.Dates
The follows after all of the columns involved in the second section:third section It contains the Values. The first row must contain the , and the rows below are thedates themselves (must be number format, not text)values In the example of above, this section ranges from tocolumn C column G.

The must have the namefirst column .Date Simply add a column with the name . As above, the cohort names must be formatted asCohort to be recognized by xP&A.Dates The other columns can be for additional dimensions an/or data items.

: A magic number this low indicates that something is wrong with your business model. Whether it be high costs relative to performance or perhaps you have not achieved product-market fit. This is not the time to invest in Sales and Marketing, focus should be elsewhere.Magic Number < 0.5 : This is generally considered to be the main threshold for the magic number. If you’re around the 0.75 mark then your sales efficiency is approaching market norms. This is a time to evaluate whether or not to increase Sales and Marketing expense and depends on the specific context of your business. 0.5 < Magic Number < 0.75 : A magic number over 0.75 indicates that this is the time to invest in Sales and Marketing. You likely have a proven product-market fit and solid CAC payback periods and this is the time to take advantage.Magic Number > 0.75


For , cash change isAssets asset item|previous - asset item|current For , cash change is the oppositeLiability and Equity .(current - previous)


Last updated on Aug 16, 2023