If you have data sources that contain underlying data (e.g. transactions from a connected source system like Xero, QuickBooks Online, NetSuite, Google Sheets or a CSV import in transaction format), Lucanet xP&A (Extended Planning & Analysis) allows you to drill-down into the underlying detail, from any variables connected directly to that data.

Drill-downs are possible from the spreadsheet of a model, from the 'Data' workspace, or from the dashboard.

The drill-down function:

To drill-down on integrated data from the spreadsheet:

1

In the Data column, click the data icon Data icon for the desired data source.

2

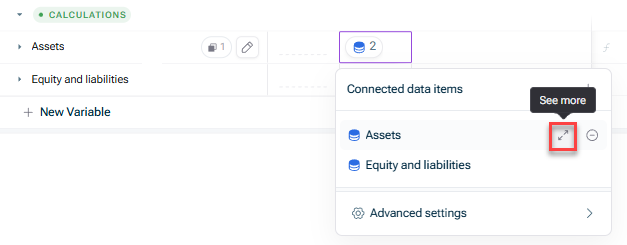
Click the expand arrow icon behind the data item for which you would like to open the drill-down:

Shows the 'Connected data items' drop-down for a data column with 2 linked items ('Assets', 'Equity and liabilities'). Highlighted in red is the expand arrow icon next to 'Assets', with the tooltip 'See more'.
The 'Expand arrow' icon
3

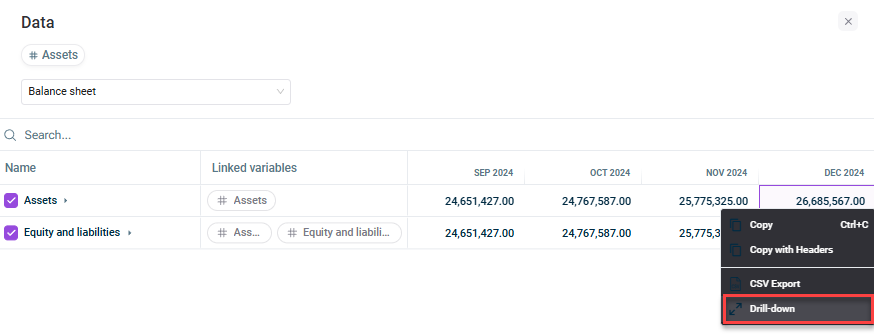
In the Data dialog that is displayed, right-click on the value for which you would like to open and choose Drill-down from the context menu:

Shows the 'Data' dialog for the 'Assets' data source with a table of values by month. A right-click context menu is open on a cell, with 'Drill-down' highlighted in red.
Opening the drill-down dialog

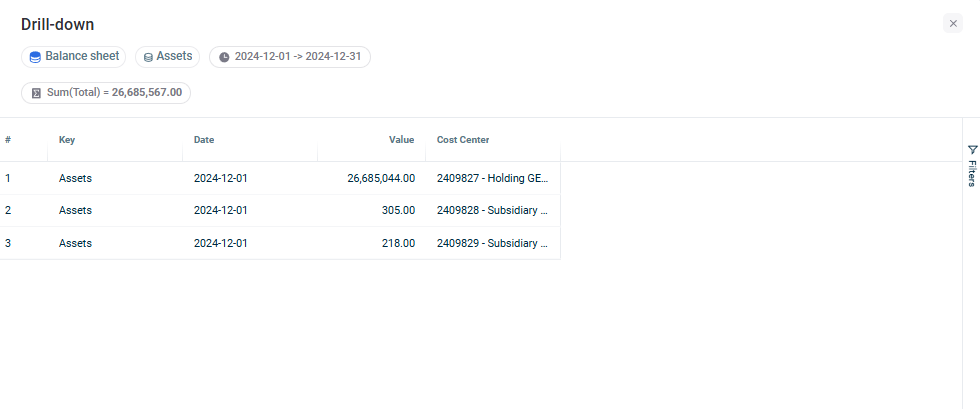
The drill-down is displayed as follows, for example:

Shows the 'Drill-down' dialog for the 'Assets' data item in the 'Balance sheet' data source, with the selected date range, the total sum, and a transaction table listing 'Key', 'Date', 'Value', and 'Cost Center'.
The 'Drill-down' dialog

To drill down on integrated data in the spreadsheet, a user needs edit or above access permissions to the respective model.

To drill-down on integrated data from the Data workspace: by clicking on the data icon in the Data column, hovering over a row with a data icon, and clicking on the expand arrows:

1

Open the desired data source from the Data workspace.

2

Navigate to the Data tab.

3

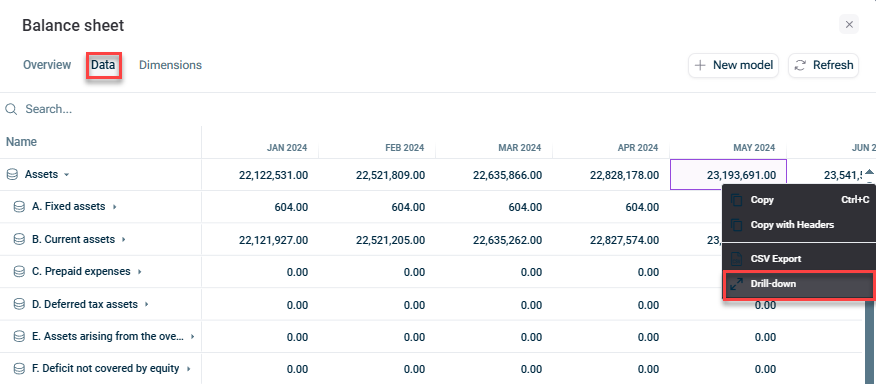
Right-click on the cell for which you would like to open the drill-down and choose Drill-down from the context menu:

Shows the 'Data' tab of the 'Balance sheet' data source, highlighted in red, with a table of accounts and monthly values. A right-click context menu is open on a cell, with 'Drill-down' highlighted in red.
Opening the 'Drill-down' dialog
4

The drill-down is displayed as follows, for example:

Shows the 'Drill-down' dialog for the 'Assets' data item in the 'Balance sheet' data source, with the selected date range, the total sum, and a transaction table listing 'Key', 'Date', 'Value', and 'Cost Center'.
The 'Drill-down' dialog

To drill down on integrated data in the spreadsheet, a user needs edit or above access permissions to the respective model.

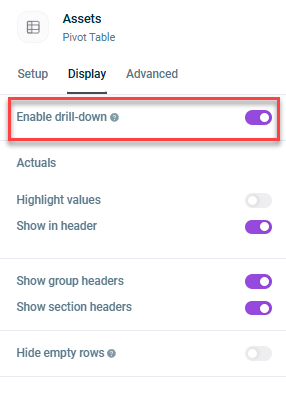
You can also enable drill-down in Tables and Bar charts on the Display tab when editing a chart or table.

Shows the option 'Enable drill-down' on the Display tab that appears when editing the settings of a chart or table
Drill-down from the dashboard
  • This function is deactivated by default due to the potential sensitivity of underlying data.
  • To drill down on integrated data in the spreadsheet, a user needs edit or above access permissions to the respective model.
  • Users with view access to the model will only be able to drill-down on the dashboard if the drill-down option has been enabled on a table.
  • Even if you have enabled the read-only spreadsheet on the dashboard, drill-down will not be available there.

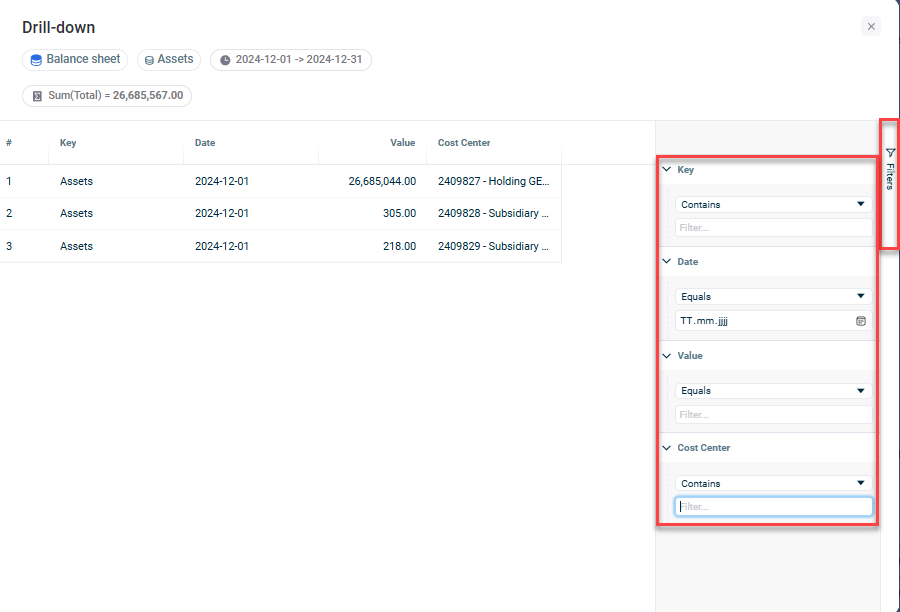
Use the Filters panel on the right-hand side of the Drill-down dialog to filter the list of transactions (e.g. based on transaction memos, GL codes, values, dates).

You can also click the column headers to sort in ascending/descending order.

Shows the Filter panel that can be opened on the right-hand side of the drill-down dialog with the fields to search for key, date, value and cost center in this example.
Filtering transactions

This content was generated using AI and reviewed by Lucanet subject matter experts before publication.