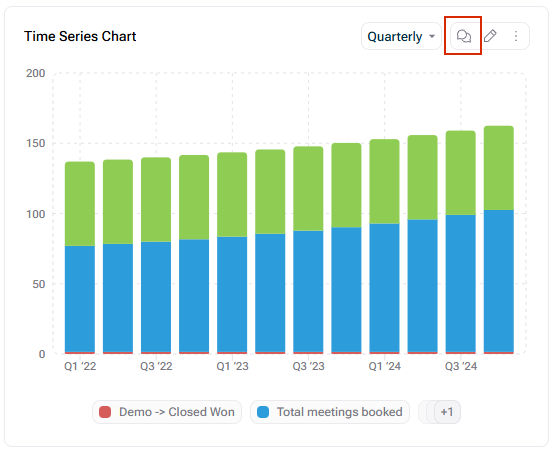
Dashboards in Lucanet xP&A (Extended Planning & Analysis) are a nice way for others to view and interact with your model. It shows your model's input variables at the top, with its charts underneath. You also have the option to show them a read-only spreadsheet view, too.
Dashboards can be useful in various contexts:
For sharing with current or potential investors
For collaborating with non-finance team members
For model-builders that want to zoom out from the detail of the spreadsheet
Dashboard viewers can adjust the value of the input variables to see what happens in different situations. These changes aren't saved to your model, unless they have edit access, in which case they'll see a Save changes button.
Each variable in the Inputs section of your model will appear as an adjustable input at the top of the Dashboard, see also Input Section under Using Sections.
The adjustable inputs section of the Dashboard is split up into tabs if variables are grouped. This makes it easy to navigate when there are lots of input variables.
If you don't want a variable to appear as an adjustable input, move it out of your model's Inputs section.