This article explains how ranges and Monte Carlo simulations as well as different distribution shapes are used in Lucanet xP&A (Extended Planning & Analysis) to model uncertainty in formulas, enabling more realistic and probabilistic forecasting.
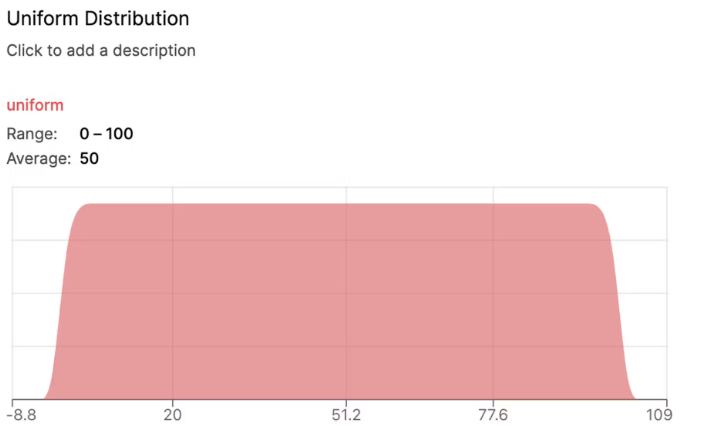
When variables in Lucanet xP&A are in the format of a range (e.g. 0 to 100, uniform(0,100), a Monte Carlo simulation is run to estimate the possible outcomes of an uncertain event. Monte Carlo will randomly pick a value from the distribution and compute the whole model as if it were that random constant value. This process is repeated multiple times to generate distributions for the output variables.
The use of the simulation allows xP&A to perform computations using values with uncertainty that are not possible without it. Due to this method of handling uncertainty, you may notice that the range of the cell and the value are not the numbers you input or would expect, but only by a trivial amount.
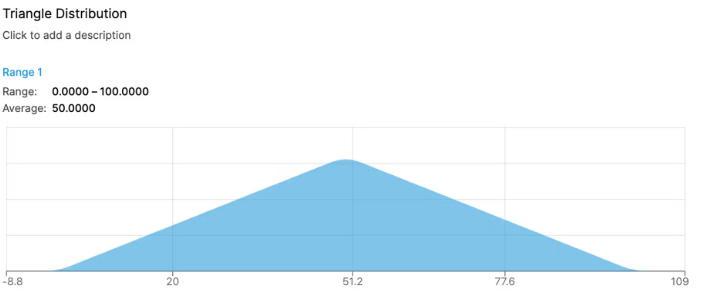
In Lucanet xP&A, values in the format of '# to #' produce a triangle distribution where the center value is the most likely value, while the edges of the range are the least likely:
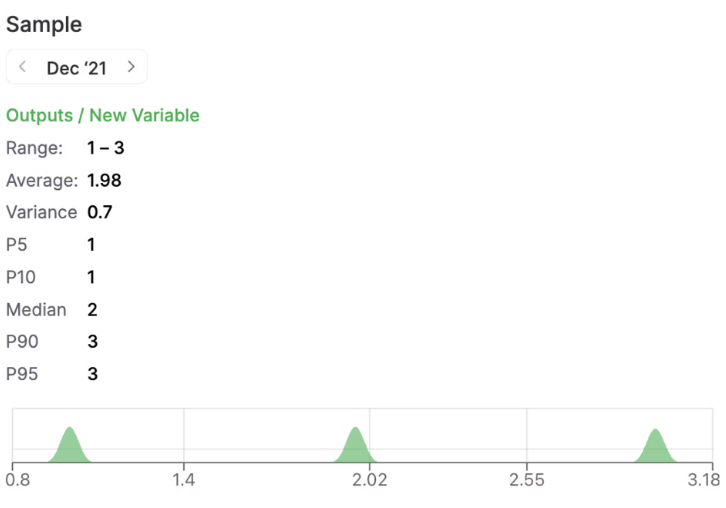
The sample function in Lucanet xP&A takes a random sample from the provided numbers. For example, sample(1,2,3) may return 1, 2 or 3 with equal probability.
Chart with Sample function
This content was generated using AI and reviewed by Lucanet subject matter experts before publication.