Besides a narrative answer, the Analyst Agent can turn an analysis into a downloadable chart, a PowerPoint or Excel file, or an interactive HTML simulation.
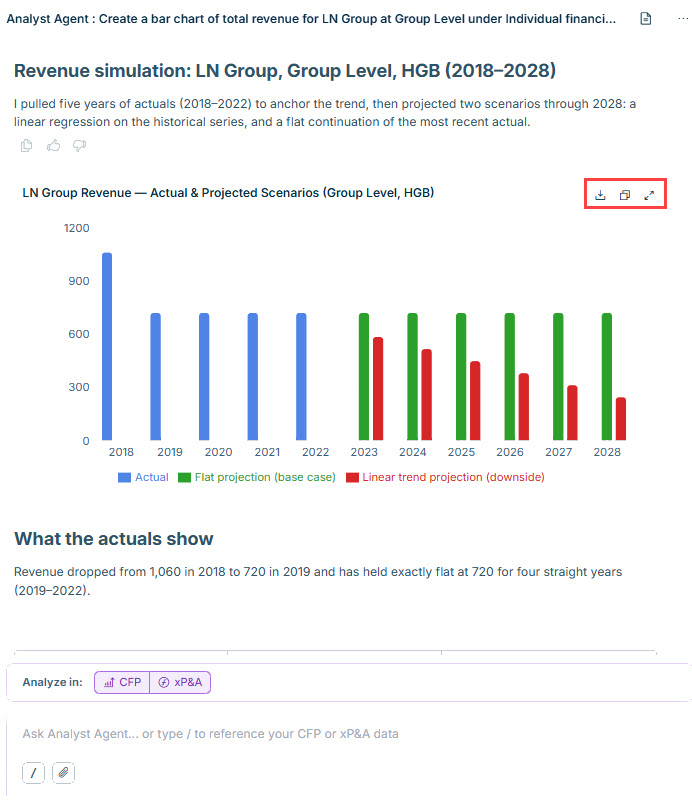
You can ask the Analyst Agent to visualize a result and it adds a chart to its response. You can download the chart image, copy it, or expand it to full size using the icons in its top-right corner.
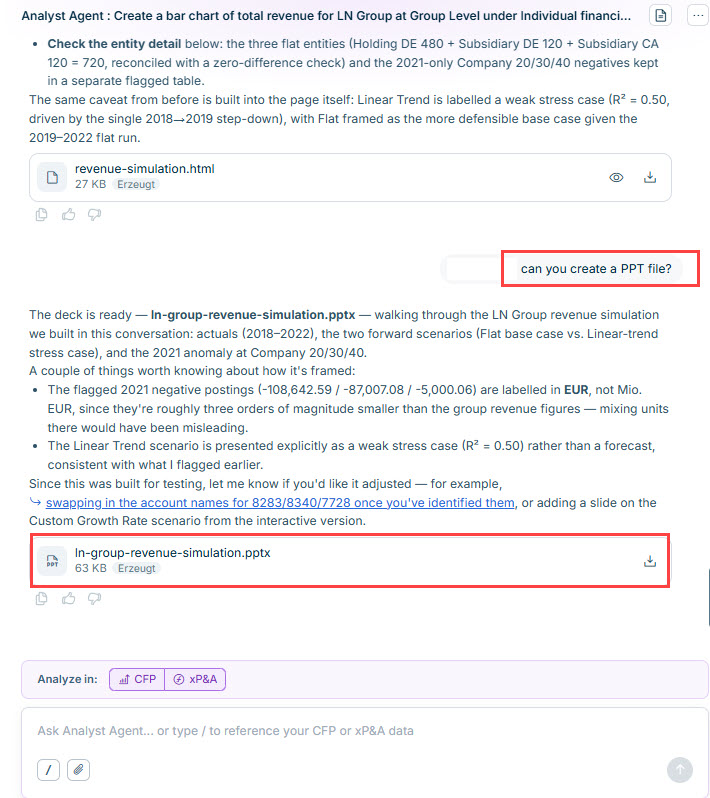
You can ask the Analyst Agent to turn an analysis into a PowerPoint or Excel file, for example:
"Please provide this as a board PowerPoint slide deck."
The Analyst Agent builds the file and offers it as a download; opening it works like any other downloaded PowerPoint or Excel file.
Files that the Analyst Agent in Lucanet Lume delivers, such as PowerPoint, Excel, or HTML files, are marked as AI-generated, as required by the EU AI Act.
A PowerPoint file generated by the Analyst Agent, ready to download
You can define the layout of the generated PowerPoint or Excel file, for example your company's font and color palette, in two ways: attach an example file to use its layout for the current conversation only, or add an entry to the Analyst Agent's memory to reuse it across future conversations. See Personalizing Analyst Agent with Memories to learn how to add and manage memories.
You can ask the Analyst Agent to build a simulation, for example:
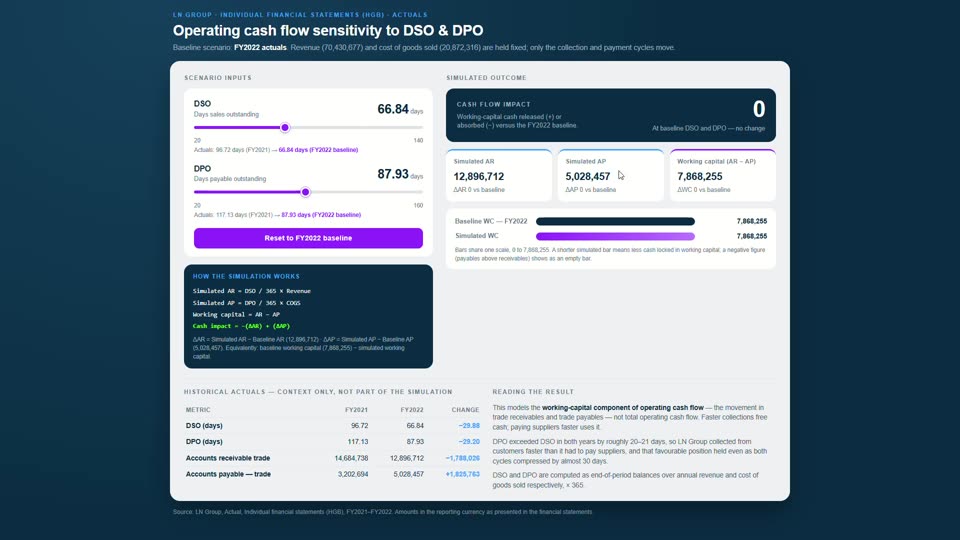
"Create an HTML simulation with a slider to change the drivers for DSO and DPO and the resulting cash flow impact."
The Analyst Agent opens the simulation as a report with adjustable sliders for the scenario inputs, the resulting impact, and an explanation of how the simulation works.
An interactive simulation built by the Analyst Agent
Refer to Personalizing Analyst Agent with Memories to have the Analyst Agent remember your preferences, for example a brand color palette for generated decks, across conversations.
This content was generated using AI and reviewed by Lucanet subject matter experts before publication.