A placeholder is a variable that is replaced by actual values.
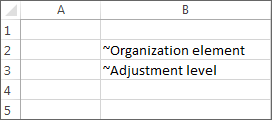
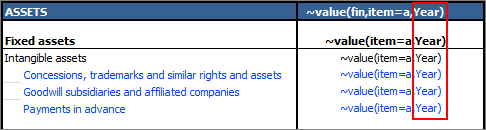
In tilde formulas, placeholders can be used as substitutes for data levels, adjustment levels, organization elements, partners, transaction currency, display currency, periods, and time intervals, or as parameters of functions or statements.
When creating a report, the placeholders can be configured individually, i.e., you can configure whether a value for this placeholder is fixed or can be selected as required. For additional information, see Generating Excel Reports.
When you want to choose several elements of the same dimension in an Excel report (e.g. the data levels Plan and Forecast), you can expand the corresponding placeholder.
Add a full stop to the dimension followed by a description, e.g.:
Data level.Plan
Data level.Forecast
Period.Comparison
Example
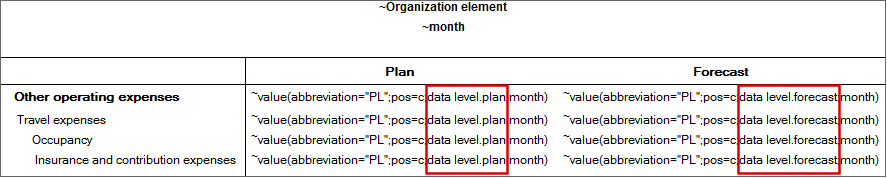
In the Excel worksheet, two different placeholders ( data level.plan and data level.forecast) are used for the Data level dimension in the tilde formula:
In a tilde formula you can use the placeholders Month, Quarter and Year for the Period parameter. All three placeholders can be defined so that further periods are calculated automatically. This makes it easy to represent time series in an Excel worksheet.
Example 1: Placeholders and additions
If the period Aug 2017 is selected before the report is generated, the following values are returned depending on the placeholder used:
~Month: Aug 2017
~Quarter: Q3.2017
~Year: 2017
~Month+1: Sep 2017
~Year+1..year +2: 2018-2019
Example 2: Forming a time series
In the tilde formula, the Month placeholder is added from column C:
Placeholder for a time series
The following months are calculated based on the month selected during the creation of the report:
You can use the Time interval placeholder to generate reports that display comparisons rather than time series. The user can choose a time interval over a defined periodicity ( year, quarter or month) covering any number of periods.
Example
The Excel worksheet contains two tilde formulas for entering revenue in two time intervals. Column D calculates the difference between the different revenue entries:
Placeholder for time intervals
When generating the report, the time periods to be compared can be selected in the detail view.
This content was generated using AI and reviewed by Lucanet subject matter experts before publication.