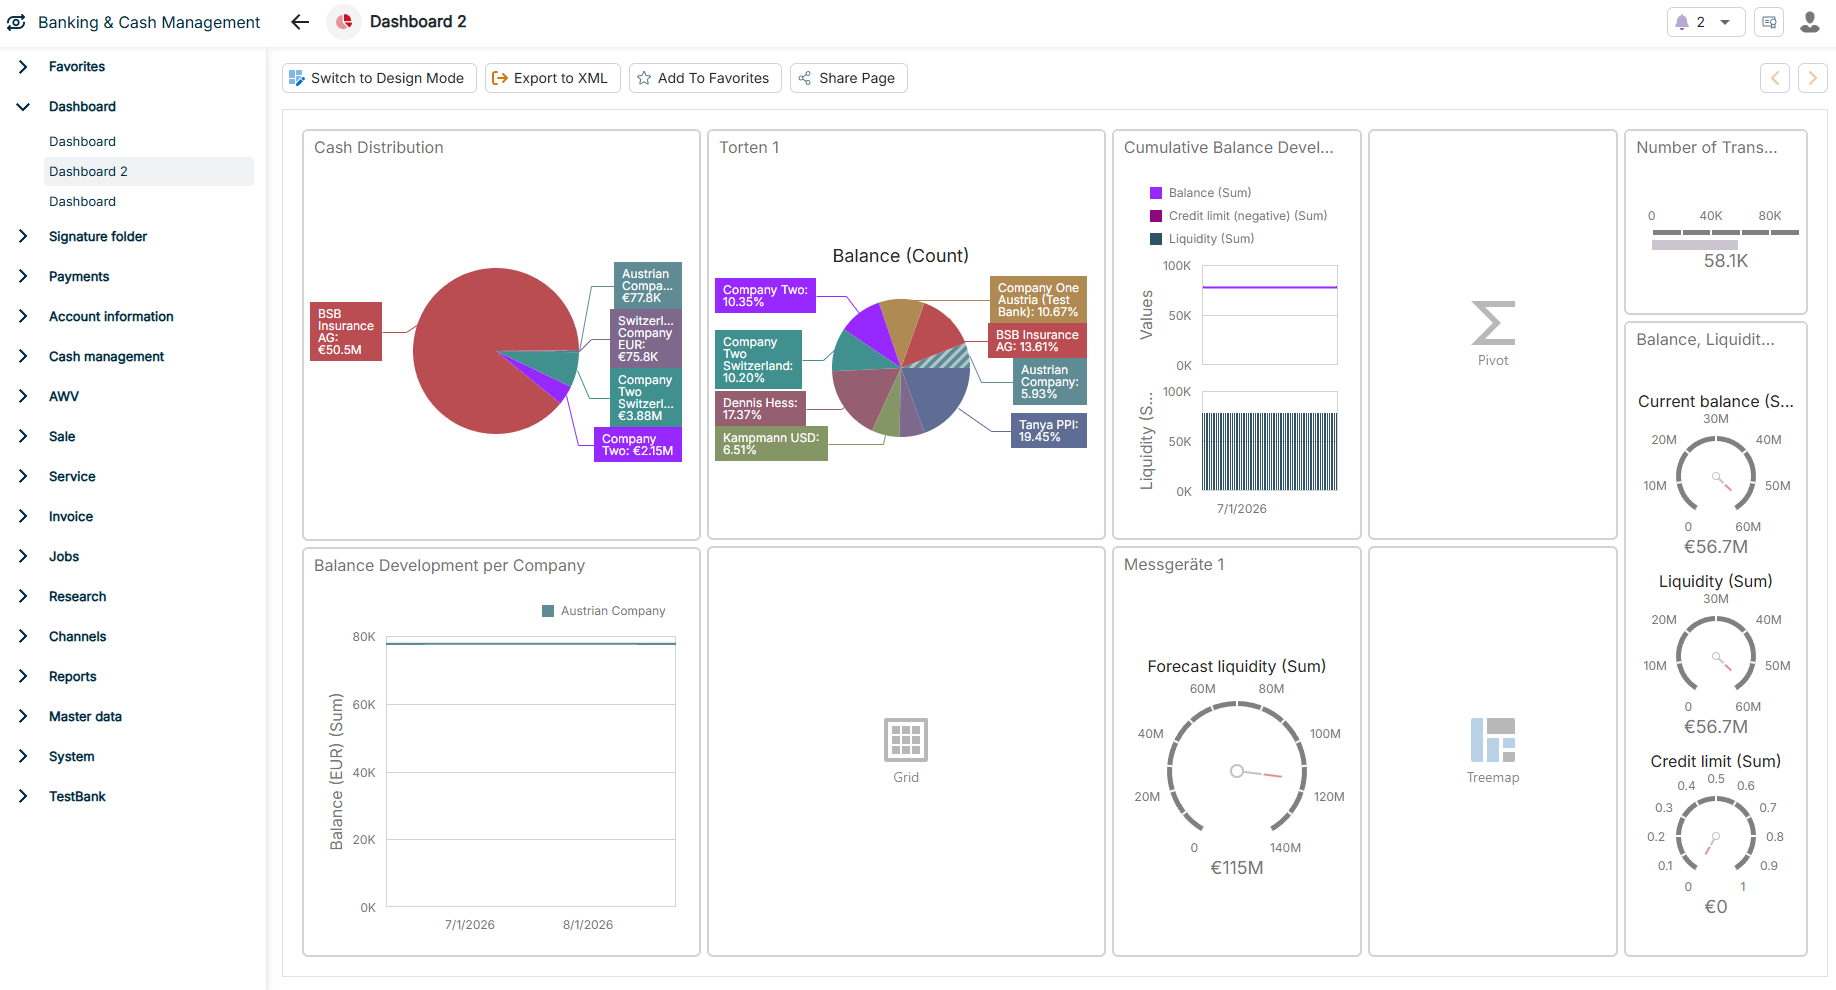
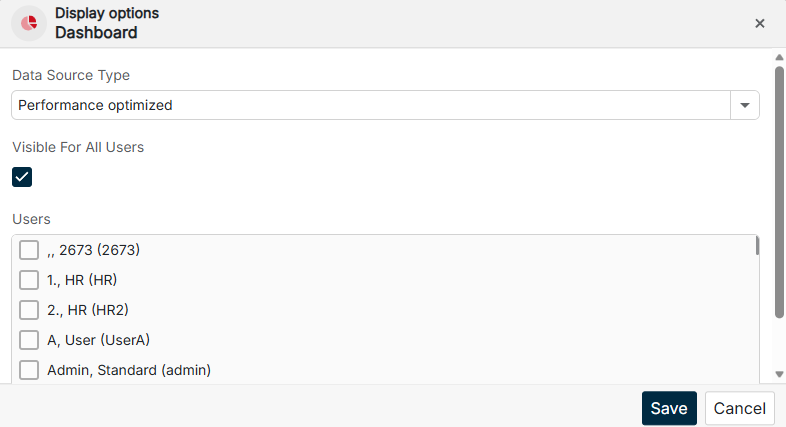
Under , you find the management view of all dashboards. This workspace is primarily used to administer and manage dashboards. You canReports | Dashboards and define for each dashboard which users can see it and how it loads its data (see the sectioncreate several dashboards ).Setting the Display Options of a Dashboard In the functional area, you find direct access to a selected dashboard. This view is intended for daily use and provides quick access to the most important KPIs.Dashboard

: Reduces loading times for large data volumes. In design mode, this mode displays only the fields that you already use in the dashboard.Performance optimized : Provides all available fields and data bindings in design mode. Set theDefault setting toData Source Type before designing a dashboard and back toDefault afterwards.Performance optimized


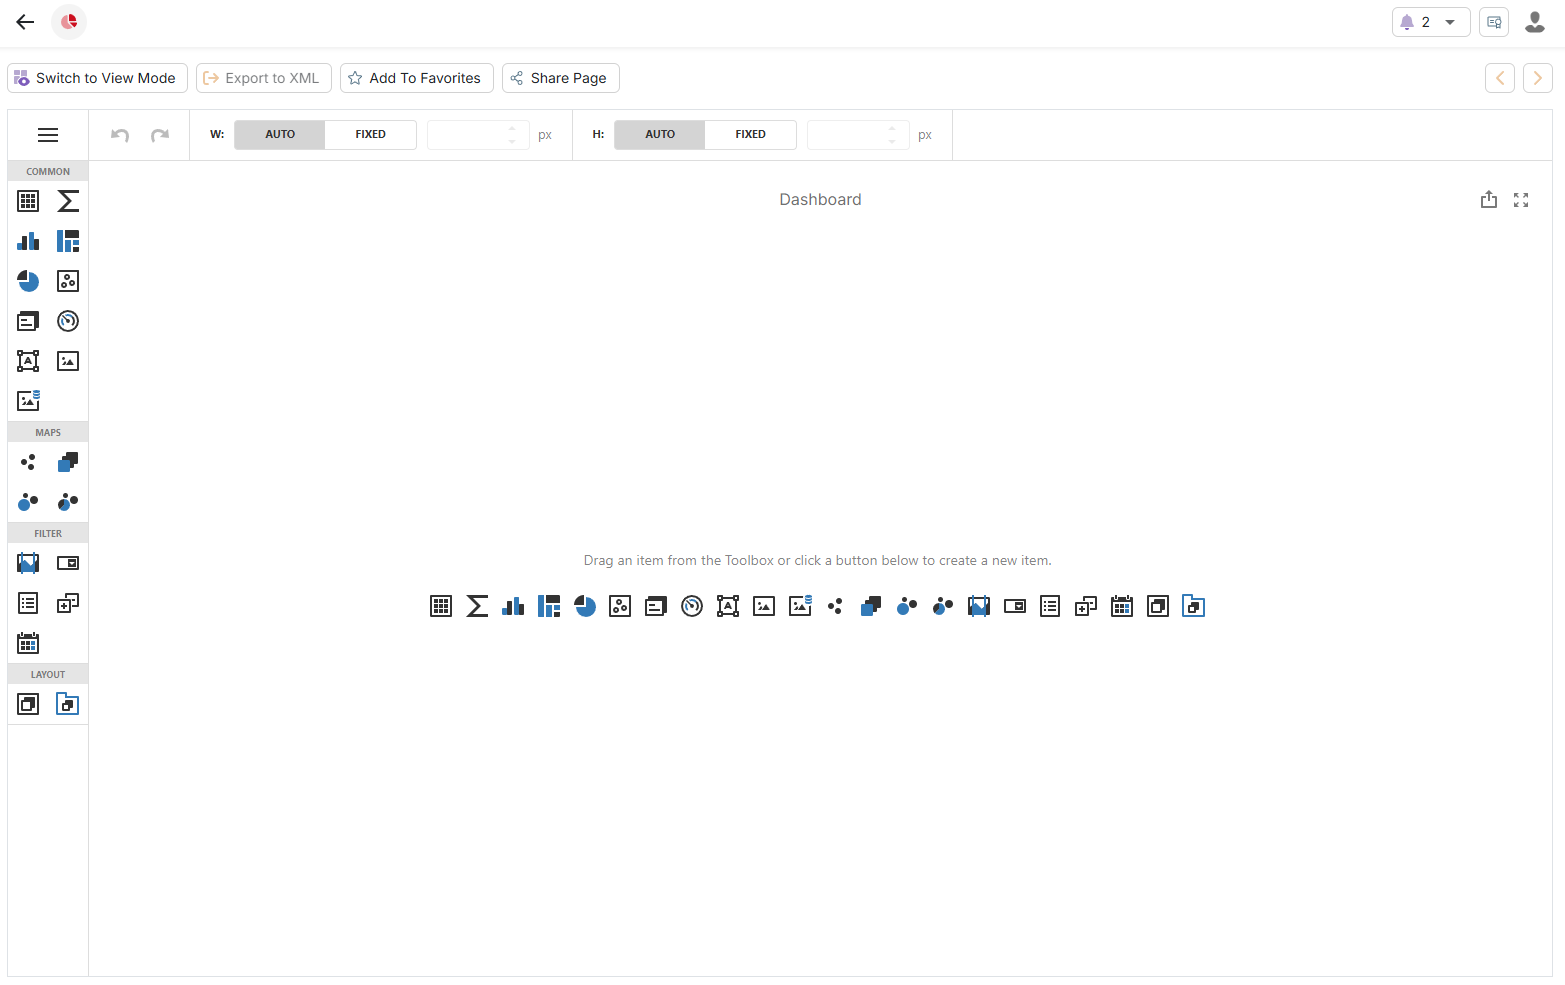
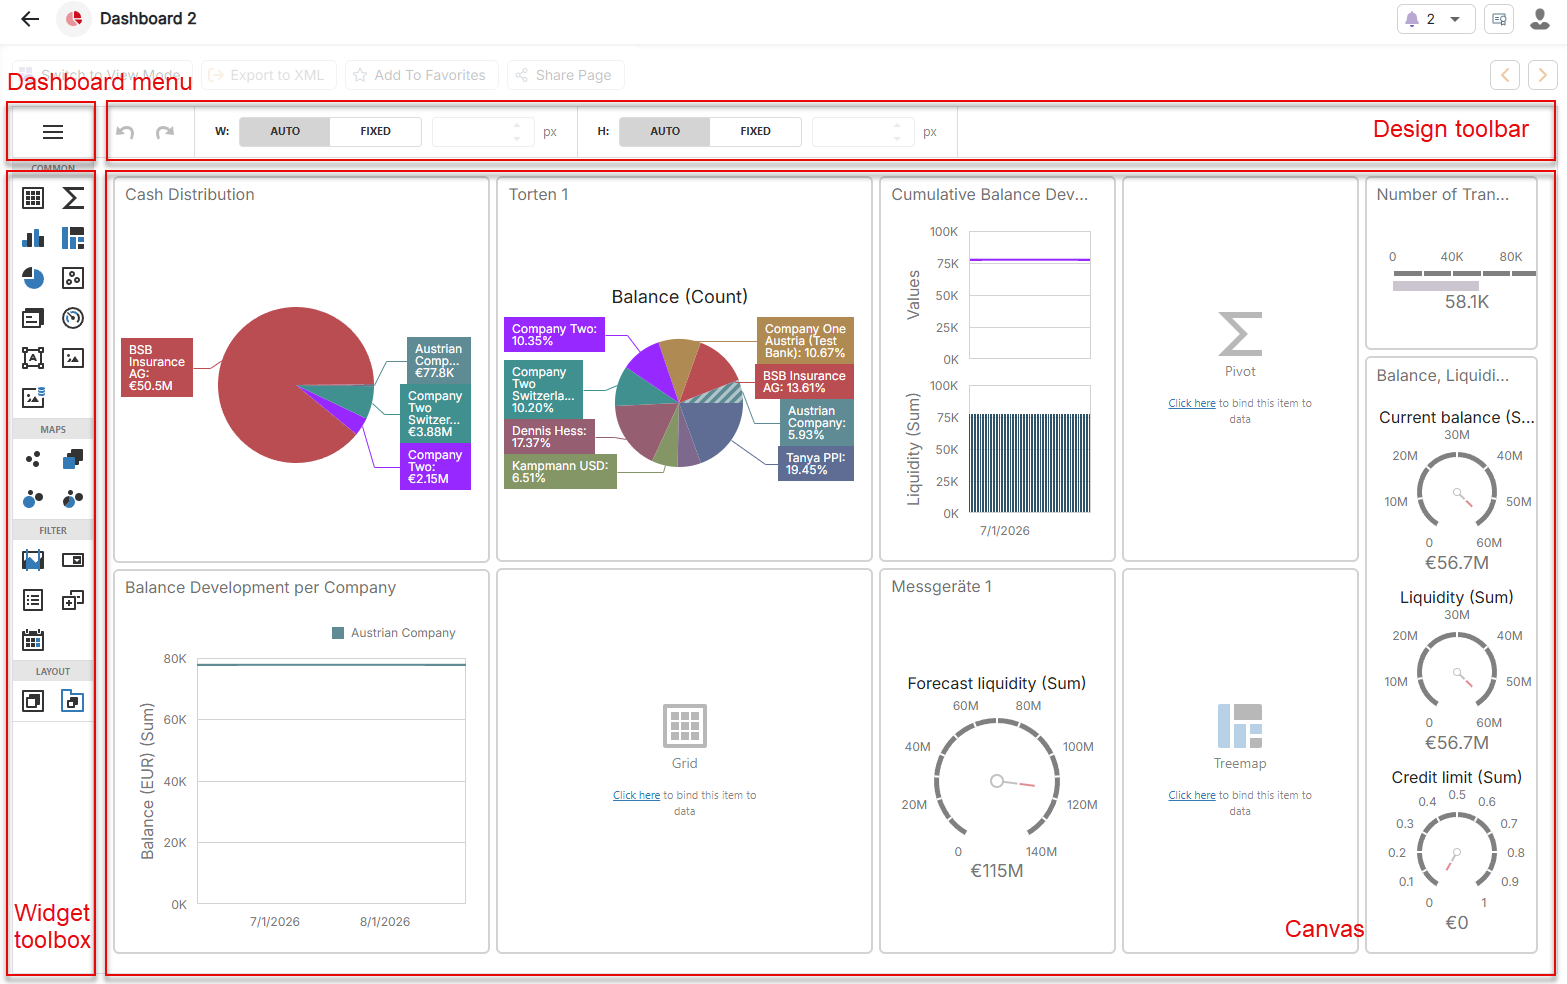
Provides access to important settings such as data sources, title, currency, parameters, and color scheme as well as theDashboard menu: functionSave Library of all available widgets, grouped into the categoriesWidget toolbox: ,Common ,Maps , andFilter Layout Area on which you arrange and design the widgets of the dashboardCanvas: Contains theDesign toolbar: andUndo functions as well as the settings for the width and height of the dashboard — each eitherRedo orAuto .Fixed
If you select an added data source, the area displays its fields. Use | |
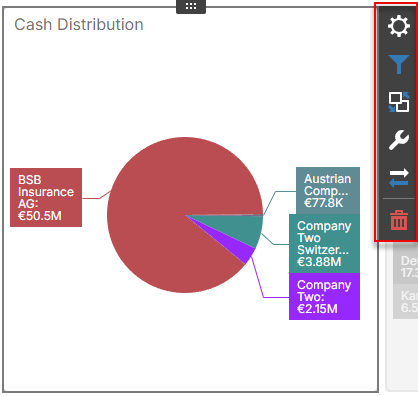
Available modes: - - - | |
Available options: - - - | |
Typical options include: - Visibility and text of the widget caption - Display of subtitles for pie widgets - Rotation of the widget - Display of labels for gauge widgets | |
- Select a predefined color scheme from the list - Use - Adjust existing color schemes via the edit icon | |
Last updated on Aug 25, 2026